By: Richard W. Sharp
Pull up a seat, it’s time for a chalk talk. We’re down to the Final Four and the Women’s NCAA Basketball Tournament, 2019 edition, has been… very predictable. In fact, the current leader among all of our benchmark brackets is chalk, by a nose.
That might sound good since we’re trying to predict the outcome, but it doesn’t present a very hopeful picture for the real contest: the pool at your local watering hole. You’re feeling pretty good right now if you played straight seeds, but the end game looks bleak. I hope you’re feeling lucky, since to take home the prize, you’re going to have to win a series of coin flip tie breakers between you and the other 70% of entrants who picked Notre Dame all the way.
Chalk, Chalk, Baby
Just how stable has the tournament been? The men’s tournament has historically averaged roughly 13 upsets per year, ranging from a minimum of 4 to a maximum of 19.1 Note that the definition of an upset used here is a win by the underdog when the difference in seeds is at least 2 (9-seed over 8-seed doesn’t count). By that definition there have been 6 upsets so far this year in the women’s tournament, and in 4 of those the difference in the seeds was 3. The only Cinderella story to tell here was 11th seeded Missouri St. which beat 6-seed DePaul and 3-seed Iowa St. before going out to second-seeded Stanford in a closely fought 55-46 game in the Sweet Sixteen.
So why is everyone adhering so closely to the script?
Well for one thing, there is a huge gap in the relative strength of the top 10 or so teams and the rest of the league. We see this in the models (e.g., the gap in team strength according to various models between the top teams and the middle of the pack), but more importantly we see it in the results. When there is a significant gap in rank between two teams, the stronger doesn’t just happen to win, it blows out the competition. The graph below compares the margin of victory in each game so far to the difference between the seeds of the competitors. Once the difference between seed reaches about 10, the median margin of victory is more than 20 points, and there have been a couple of 40+ and 50+ point drubbings. In more than half of all games, the favorite has won by more than 10 points. Hopefully, as the talent pool continues to grow, the competition will get tighter and there will be a bit more madness in this half of March.
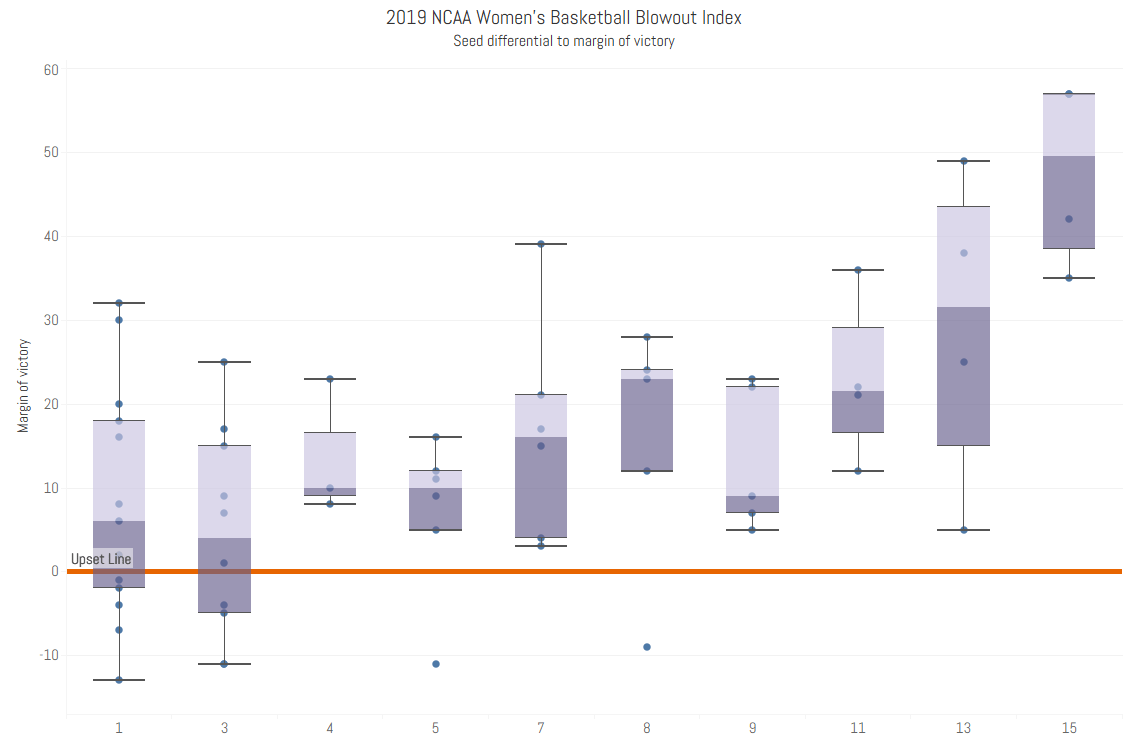
Click to zoom
The Model
This year we used the LRMC model as a baseline, and it’s doing pretty well on its own. Compared to some of our favorite benchmarks it’s one point behind chalk, 6 points ahead of RPI, and 10 points ahead of Obama. However, on its own it will end up, at best, just one among many at the head of the pack, not winner of the pool.
One of the things I love about the LRMC model is the simplicity of the data that it uses. The input primarily consists of the margin of victory from every game of the season up until the start of the tournament. But that’s got to be a pretty noisy number. What if at shot bounced out instead of in? What if that last shot after the final buzzer had come a fraction of a second earlier and gone in? How much could these differences in each game’s outcome impact the final ranking produced by the model?
We decided to run some scenarios where we introduced various kinds of noise to these outcomes. The first approach was to simply make a random adjustment to the final margin of victory (e.g., what if up to 2, 4, or 8 shots per game went the other way some percentage of the time?). Next, we got a little more detailed and considered each individual shot taken in a game (did that 3 pointer go in/out? How about that free throw?). This team-level approach means that a team that relies on three point shooting can be tested to see if it is more volatile than one that plays inside and takes a lot of free throws. In these scenarios, we assigned different miss/make probabilities to each kind of shot (free throw, 2-pointer, and 3-poitner).
Unfortunately, we don’t seem to have all of the bugs worked out of the team-level approach: the current analysis shows almost every game is predicted to be an upset and that the University of Central Florida wins it all most of the time.2 We hope to have this straightened out in time for the post-tournament recap. We also hope to put together a player-level model and see how the presence or absence of a star-player might impact a team’s ranking (the not at all hypothetical example: How much help was it for Katie Lou Samuelson to make it back from injury for UConn?). That scenario will also have to wait until after the tournament. The table below shows how each of several benchmark brackets and three scenarios with increasing levels of randomness are faring at the moment.
| Braculator comparison | ||||
|---|---|---|---|---|
| Bracket | Current points or median points | Point spread (Braculator model) | End Game | Upset performance |
| Chalk | 107 | Baylor over Miss St, ND over L’ville, ND champ. | None, by definition. | |
| LRMC standard | 106 | Baylor over Miss St, ND over UConn, ND champ. | Called 4, missed 4, 0 TBD. | |
| RPI | 100 | Baylor over Oregon, ND over L’ville, ND champ. | Called 2, missed 7, 0 TBD. | |
| Obama | 96 | Baylor over Miss St, UConn over ND, UConn champ. | Called 4, missed 7, 2 TBD. | |
| Braculator 2-shot randomness | 106 | 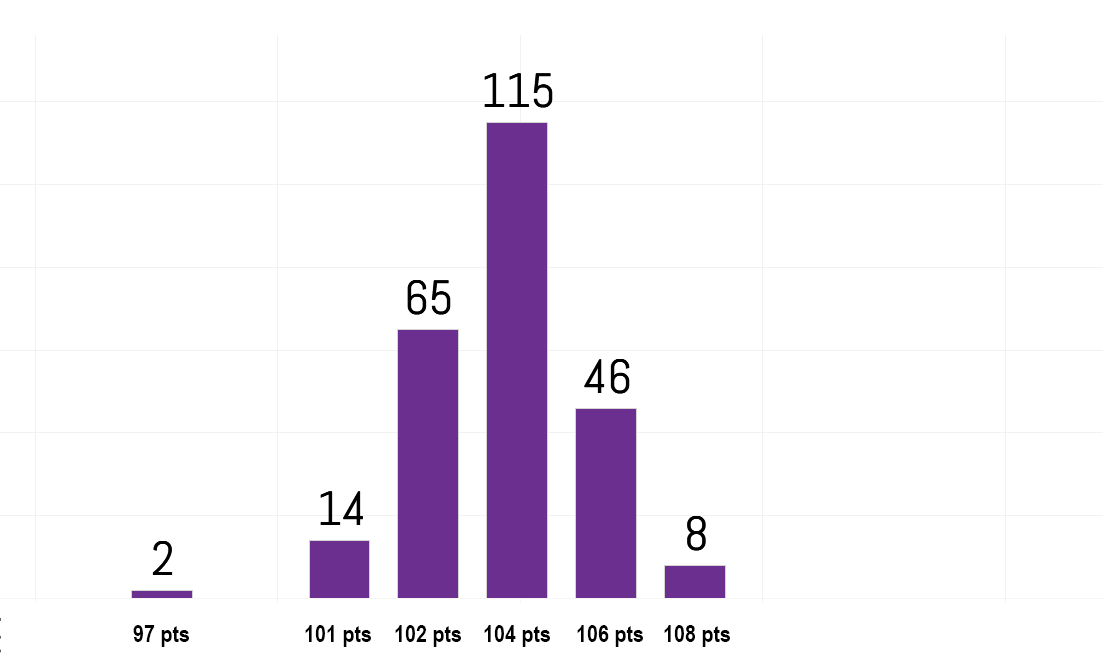 |
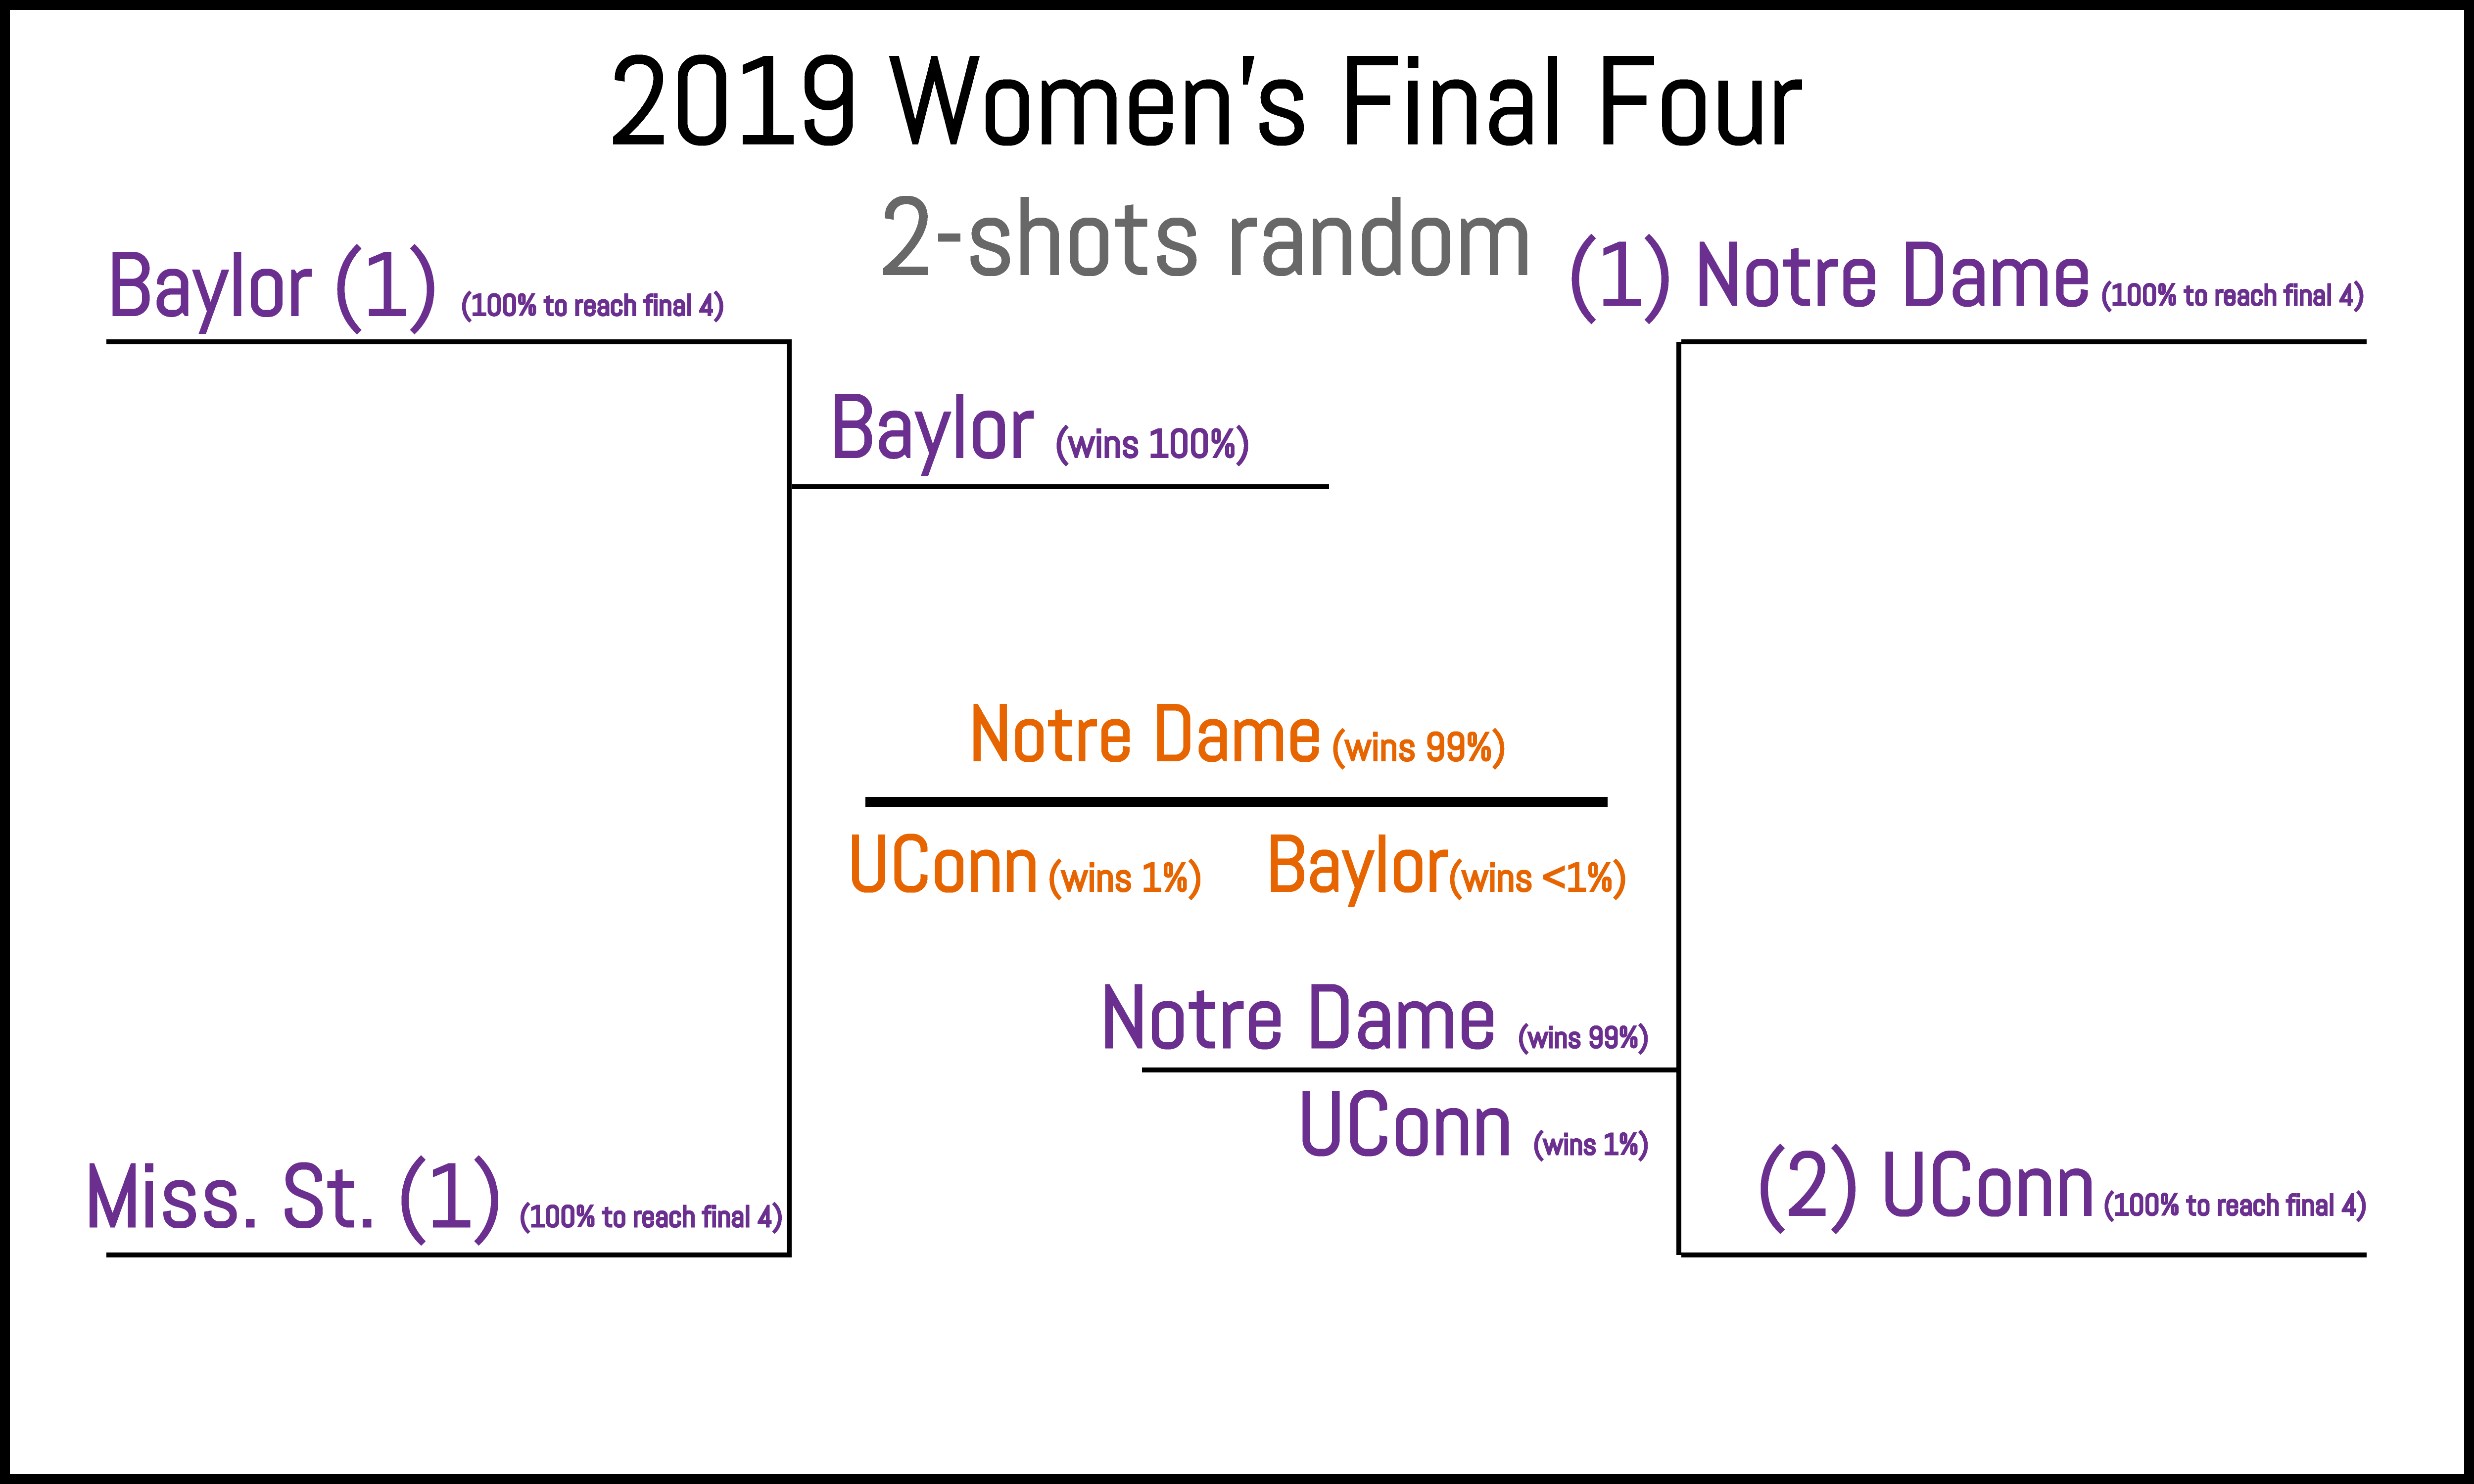 |
No difference from LRMC. |
| Braculator 4-shot randomness | 106 | 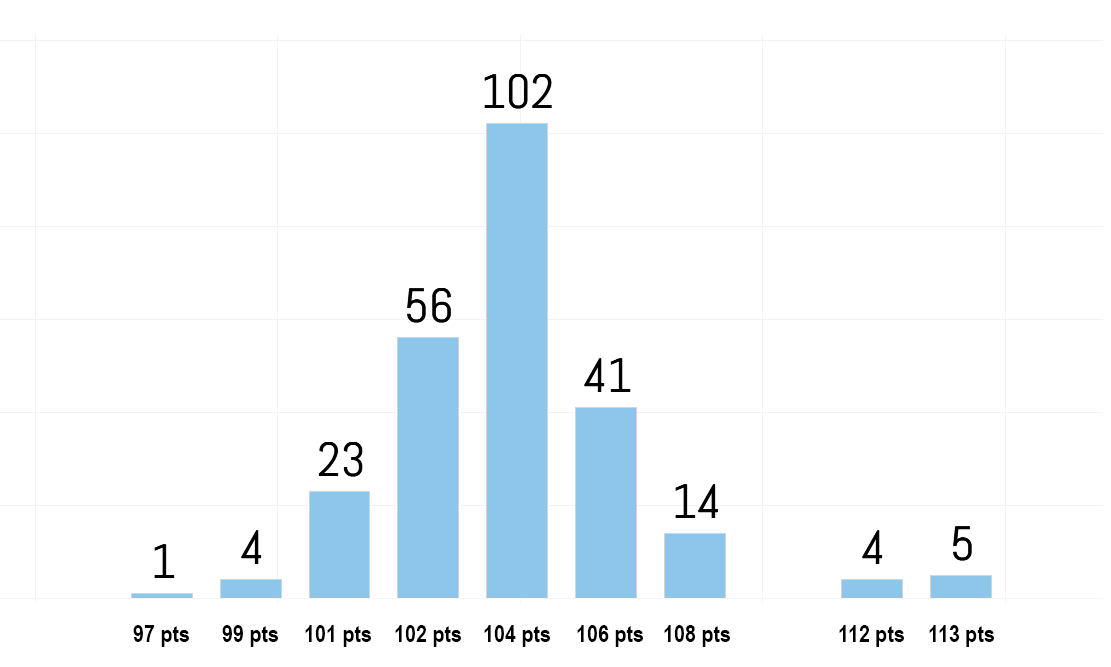 |
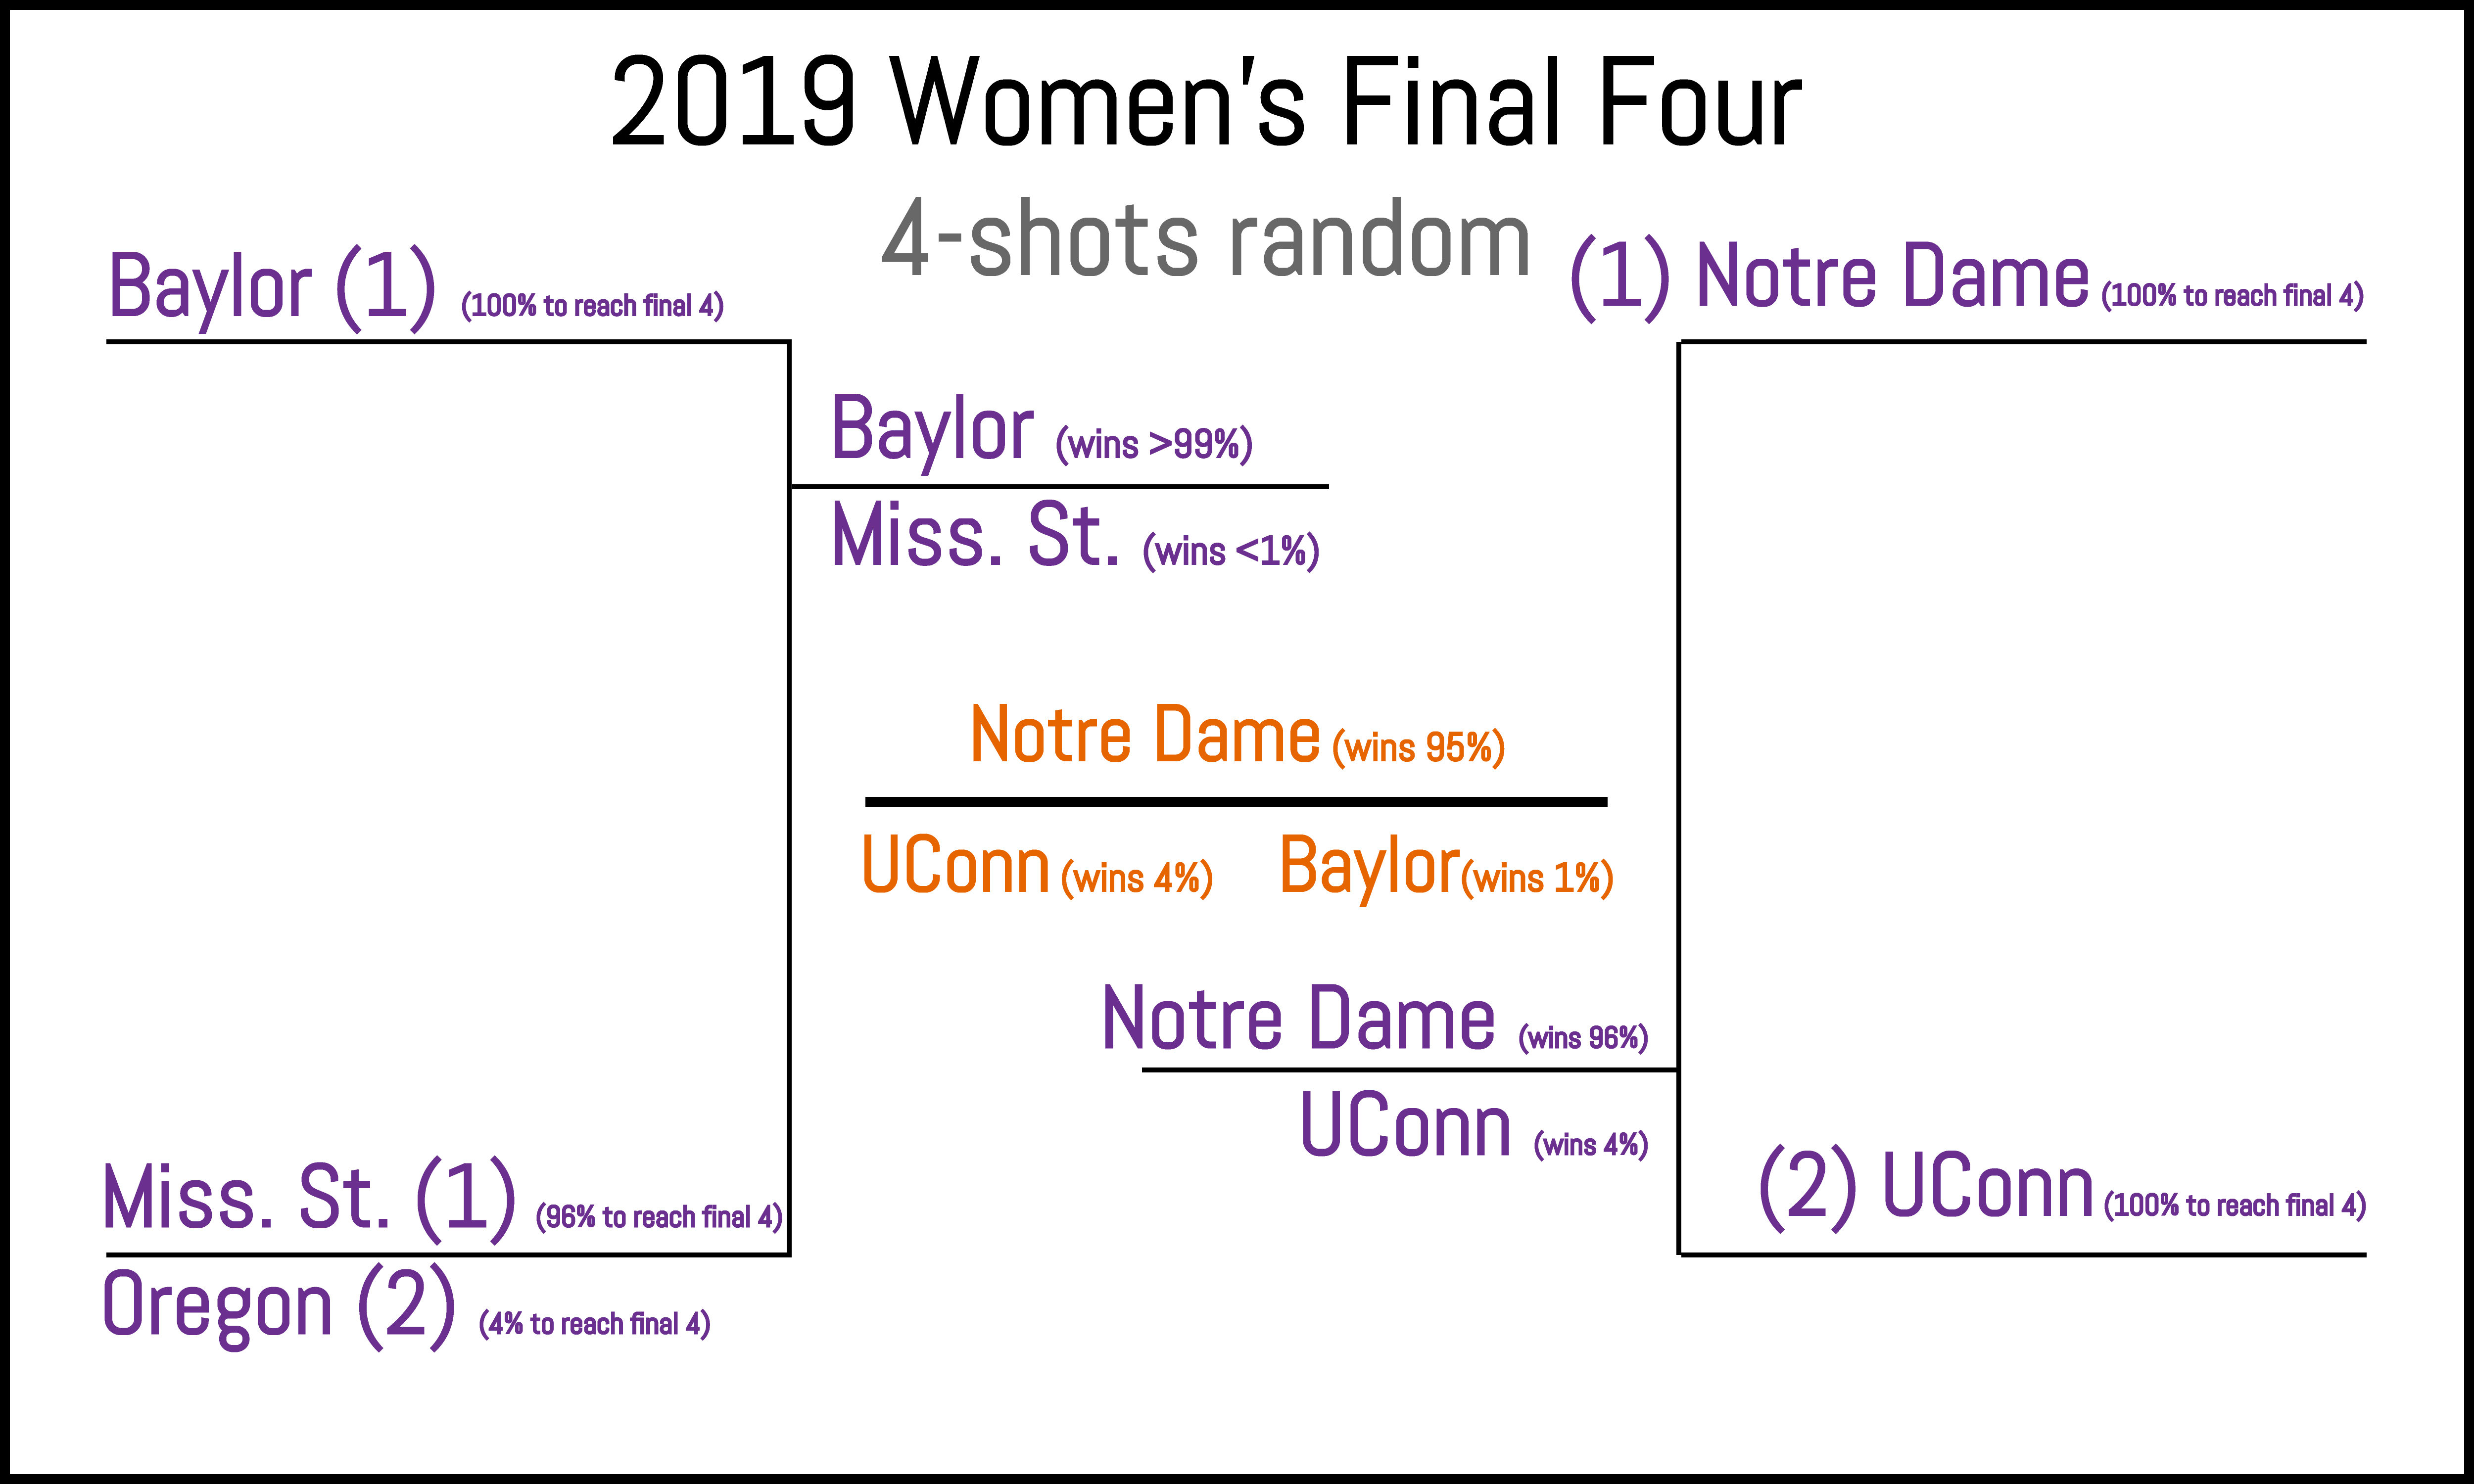 |
Oregon in the Final Four and UConn winning are edge cases. |
| Braculator 8-shot randomness | 105 | 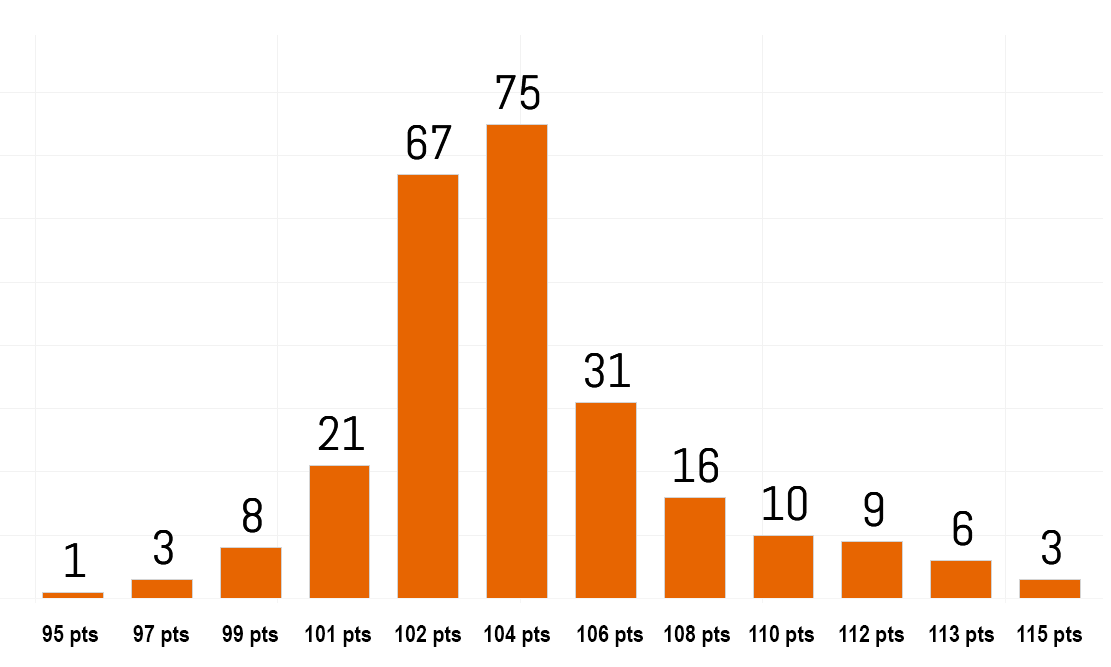 |
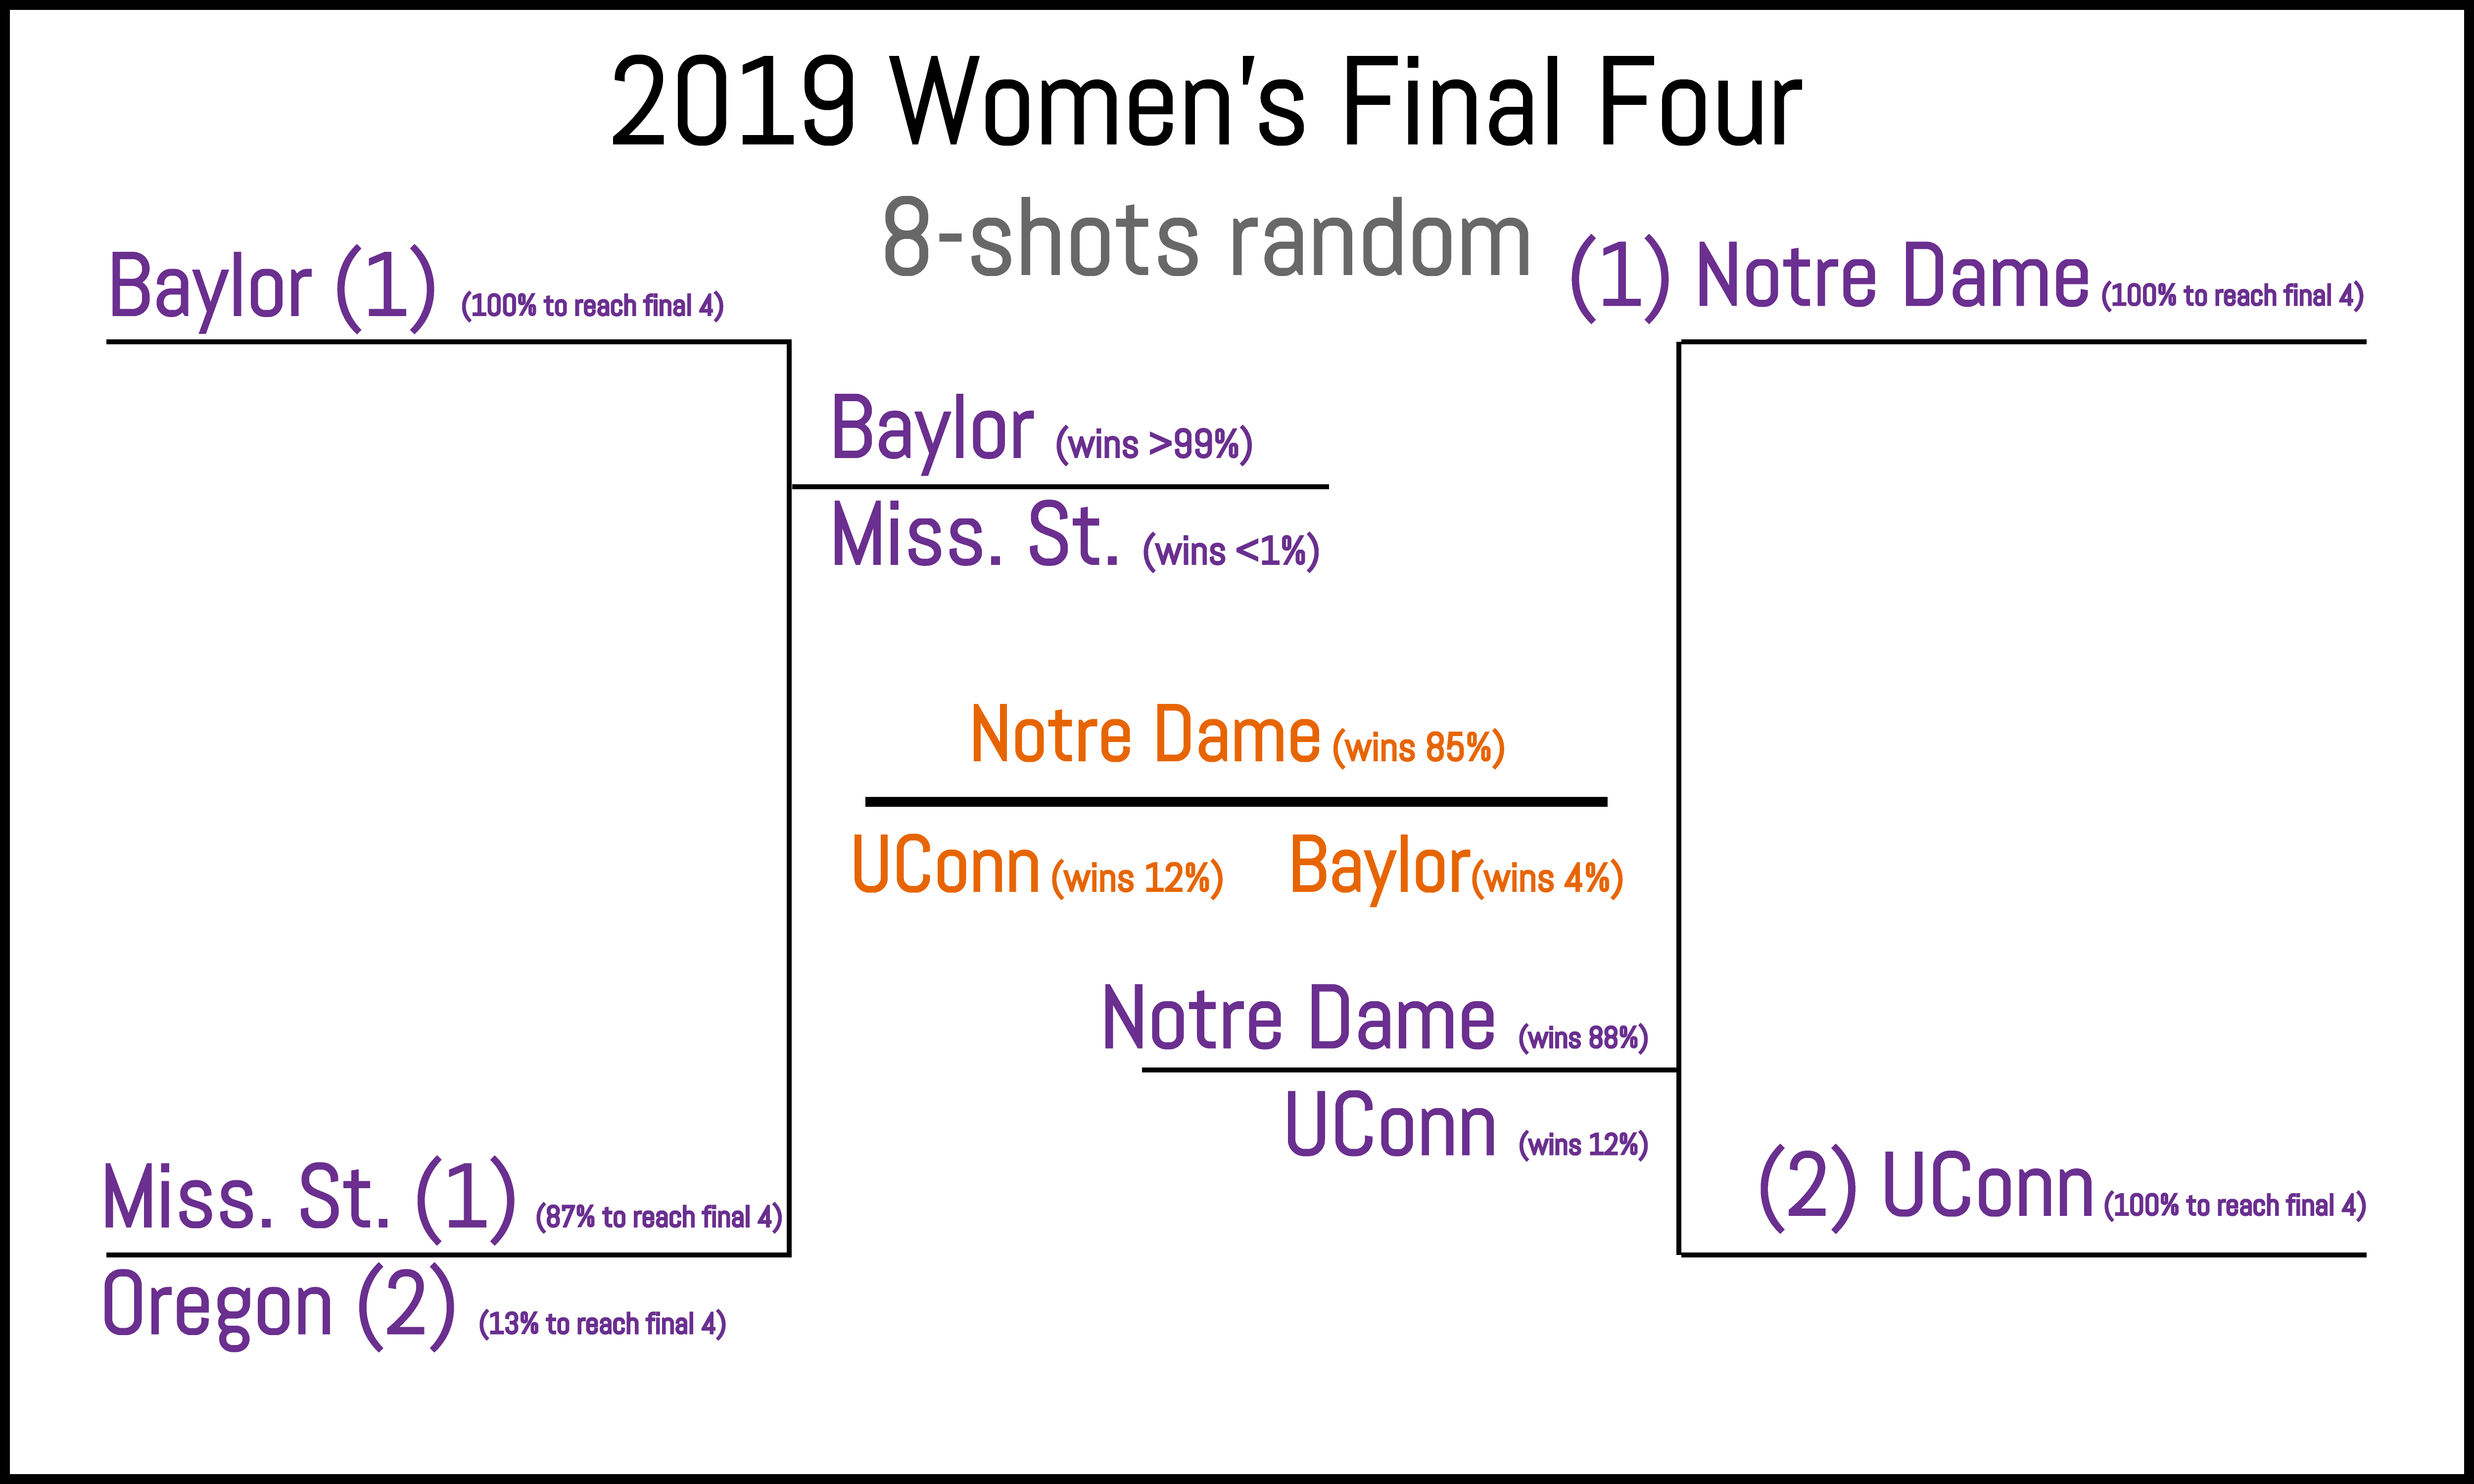 |
Correctly notes Oregon over Miss. St. as a not-unlikely scenario. UConn also given a realistic chance to win title. |
It’s pretty exciting to take a look at the end games for the three scenarios. While the most common outcome by far is the same as for the baseline LRMC model (Baylor over Miss St., Notre Dame over UConn, Notre Dame champ), some other possibilities start to appear. For example, the model’s second preference has Oregon popping up, nailing the actual Final Four. Also, while Notre Dame is still the odds on favorite to win, who’s lurking in the wings? You guessed it: UConn. And UConn always wins.
Conclusion
So what have we learned? Obama is in it to win it. He picked UConn to take it all and that puts him on track to take your money. At best you might get to split the pot with half the others in your pool, but he’s got a strategy that will set his bracket apart. The LRMC model is holding its own against straight seeds despite the fact that this tournament has stayed so close to chalk, but in the end it will all finish in a tight bunch with the rest of the benmarks. The tournament is Notre Dame’s to win, but neither RPI nor most of the play-it-safe types in your pool are going to feel very excited about that.
Notes:
1 We were unable to find a similar source for the women’s tournament, though we may be able to compile one ourselves for the next installment of this series.^
2 At Principally Uncertain, we recongize that there is much to be learned from hypotheses that don’t turn out. Namely, knowing what isn’t predictive can be extremely useful in determining what is.^
No Comments on "The Insufferable Braculator models NCAA Women’s basketball, chapter 2: Concerning chalk"