By: Patrick W. Zimmerman
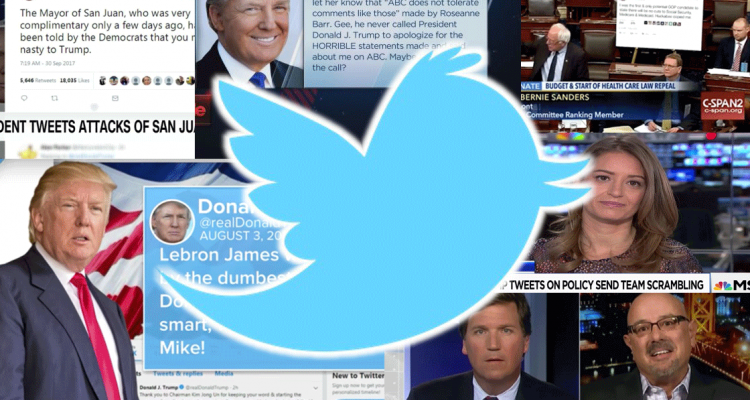
Trump has taken to the Twitters with steadily increasing frequency over the course of his presidency, and people have noticed.. This represents the increasing importance of his ability to supply his superfans and his personal Yes Media the pure, unadulterated, unfiltered Truth of @realDonaldTrump.
It’s not having the same effect it used to; apparently, there is a limit on the social media platform’s capacity to shock, awe, horrify, and disgust us. And, most importantly, Trump’s singular superpower, an ability to dictate the narrative of public political discourse with a twitch of his thumbs, seems to be waning.
How do we known? Well, for one, the GDELT project Television Explorer is an awesome, open source, indexed archive of national news coverage. Using that dataset with our Trump Watch Twitter archive allows us to compare Trump’s weekly Twitter activity to the volume of news coverage of that same activity. Let’s pick a logical start date of 1/20/2017. Ok? Done, and done.
The short-short version
Trump’s tweet frequency has risen over time, from roughly 5 per day at the beginning of his term in office to roughly 8.3 per day by the end of March, 2019. TV news coverage of his tweets, however, has fallen over the same amount of time.
Therefore:
effectiveness of each tweet at garnering attention ⇓ =
::sad_trombone::
Results
In order to measure the effect of Trump’s Twitter activity in broadcast media, we ran a search on GDELT’s explorer for Trump Twitter, which pulled up a result every time a segment ran with those two words within 15 seconds of each other.
So what did that show us?
Mouseover for details.
Right. Good reminder. He’s tweeting more because he likes the sound of his own thumbs and also because he thinks that it’s the most effective way to get around the Evil MSM-Deep State Complex™ distorting and twisting his Making Great of America to the point where only some 39-42% of the country realize how Great his Great Presidency is. There was a lull during late 2017 and early 2018 while Trump was distracted trying to talk directly to the GOP controlled Congress to enact more of his agenda than just Tax Cuts, but his tweet frequency resumed its climb shortly after the 2018 government shutdown (the first one, not the one you’re probably thinking of).
Mouseover for details.
And the reaction of the news media to his social media activity looks… a lot like a slow decline punctuated by occasional bouts of crazy. activity. The average airtime devoted to covering Trump and Twitter on the major national networks of the political center-left (MSNBC), center (CNN), and right (Fox) has steadily dropped over time. Did the Donald suddenly lose his touch sometime around August 2018?
Conclusion
Still unconvinced? Let’s combine those two charts, which represent the same time period (1/20/2017 – 3/23/2019), over the same periodicity (weekly), and have the same y-axis scaling (0 to series max), highlighting the trendlines to make things smoother and even easier to see.
Mouseover for details.
So the orange line (@realDonaldTrump) is going up and the purple line (TV airtime of @realDonaldTrump) is going down.
Q.E.D.

No Comments on "Trump’s Twitter pulpit is slowly losing its effectiveness"