By: Richard W. Sharp
On Tuesday we outlined our mad-as-a-March hare scheme for producing winning brackets. We’d combine the smart money, the models (all of them) with a healthy dose of randomness (seeded by team mascots of course). While the noise won’t always produce a winning bracket, it will produce some of the upsets you need to clean house in the office pool.
Well it’s time to put some money where our mouths are.1 We’ve produced about 10,000 brackets based on the methods outlined on Tuesday and posted them on Github (data/brackets.tgz for the curious).2 I’m not sure how we’ll do, but I’m feeling good about our chances against some of the better known competition (percentages indicate the consensus between Obama’s picks and the combined picks from 27 established models).
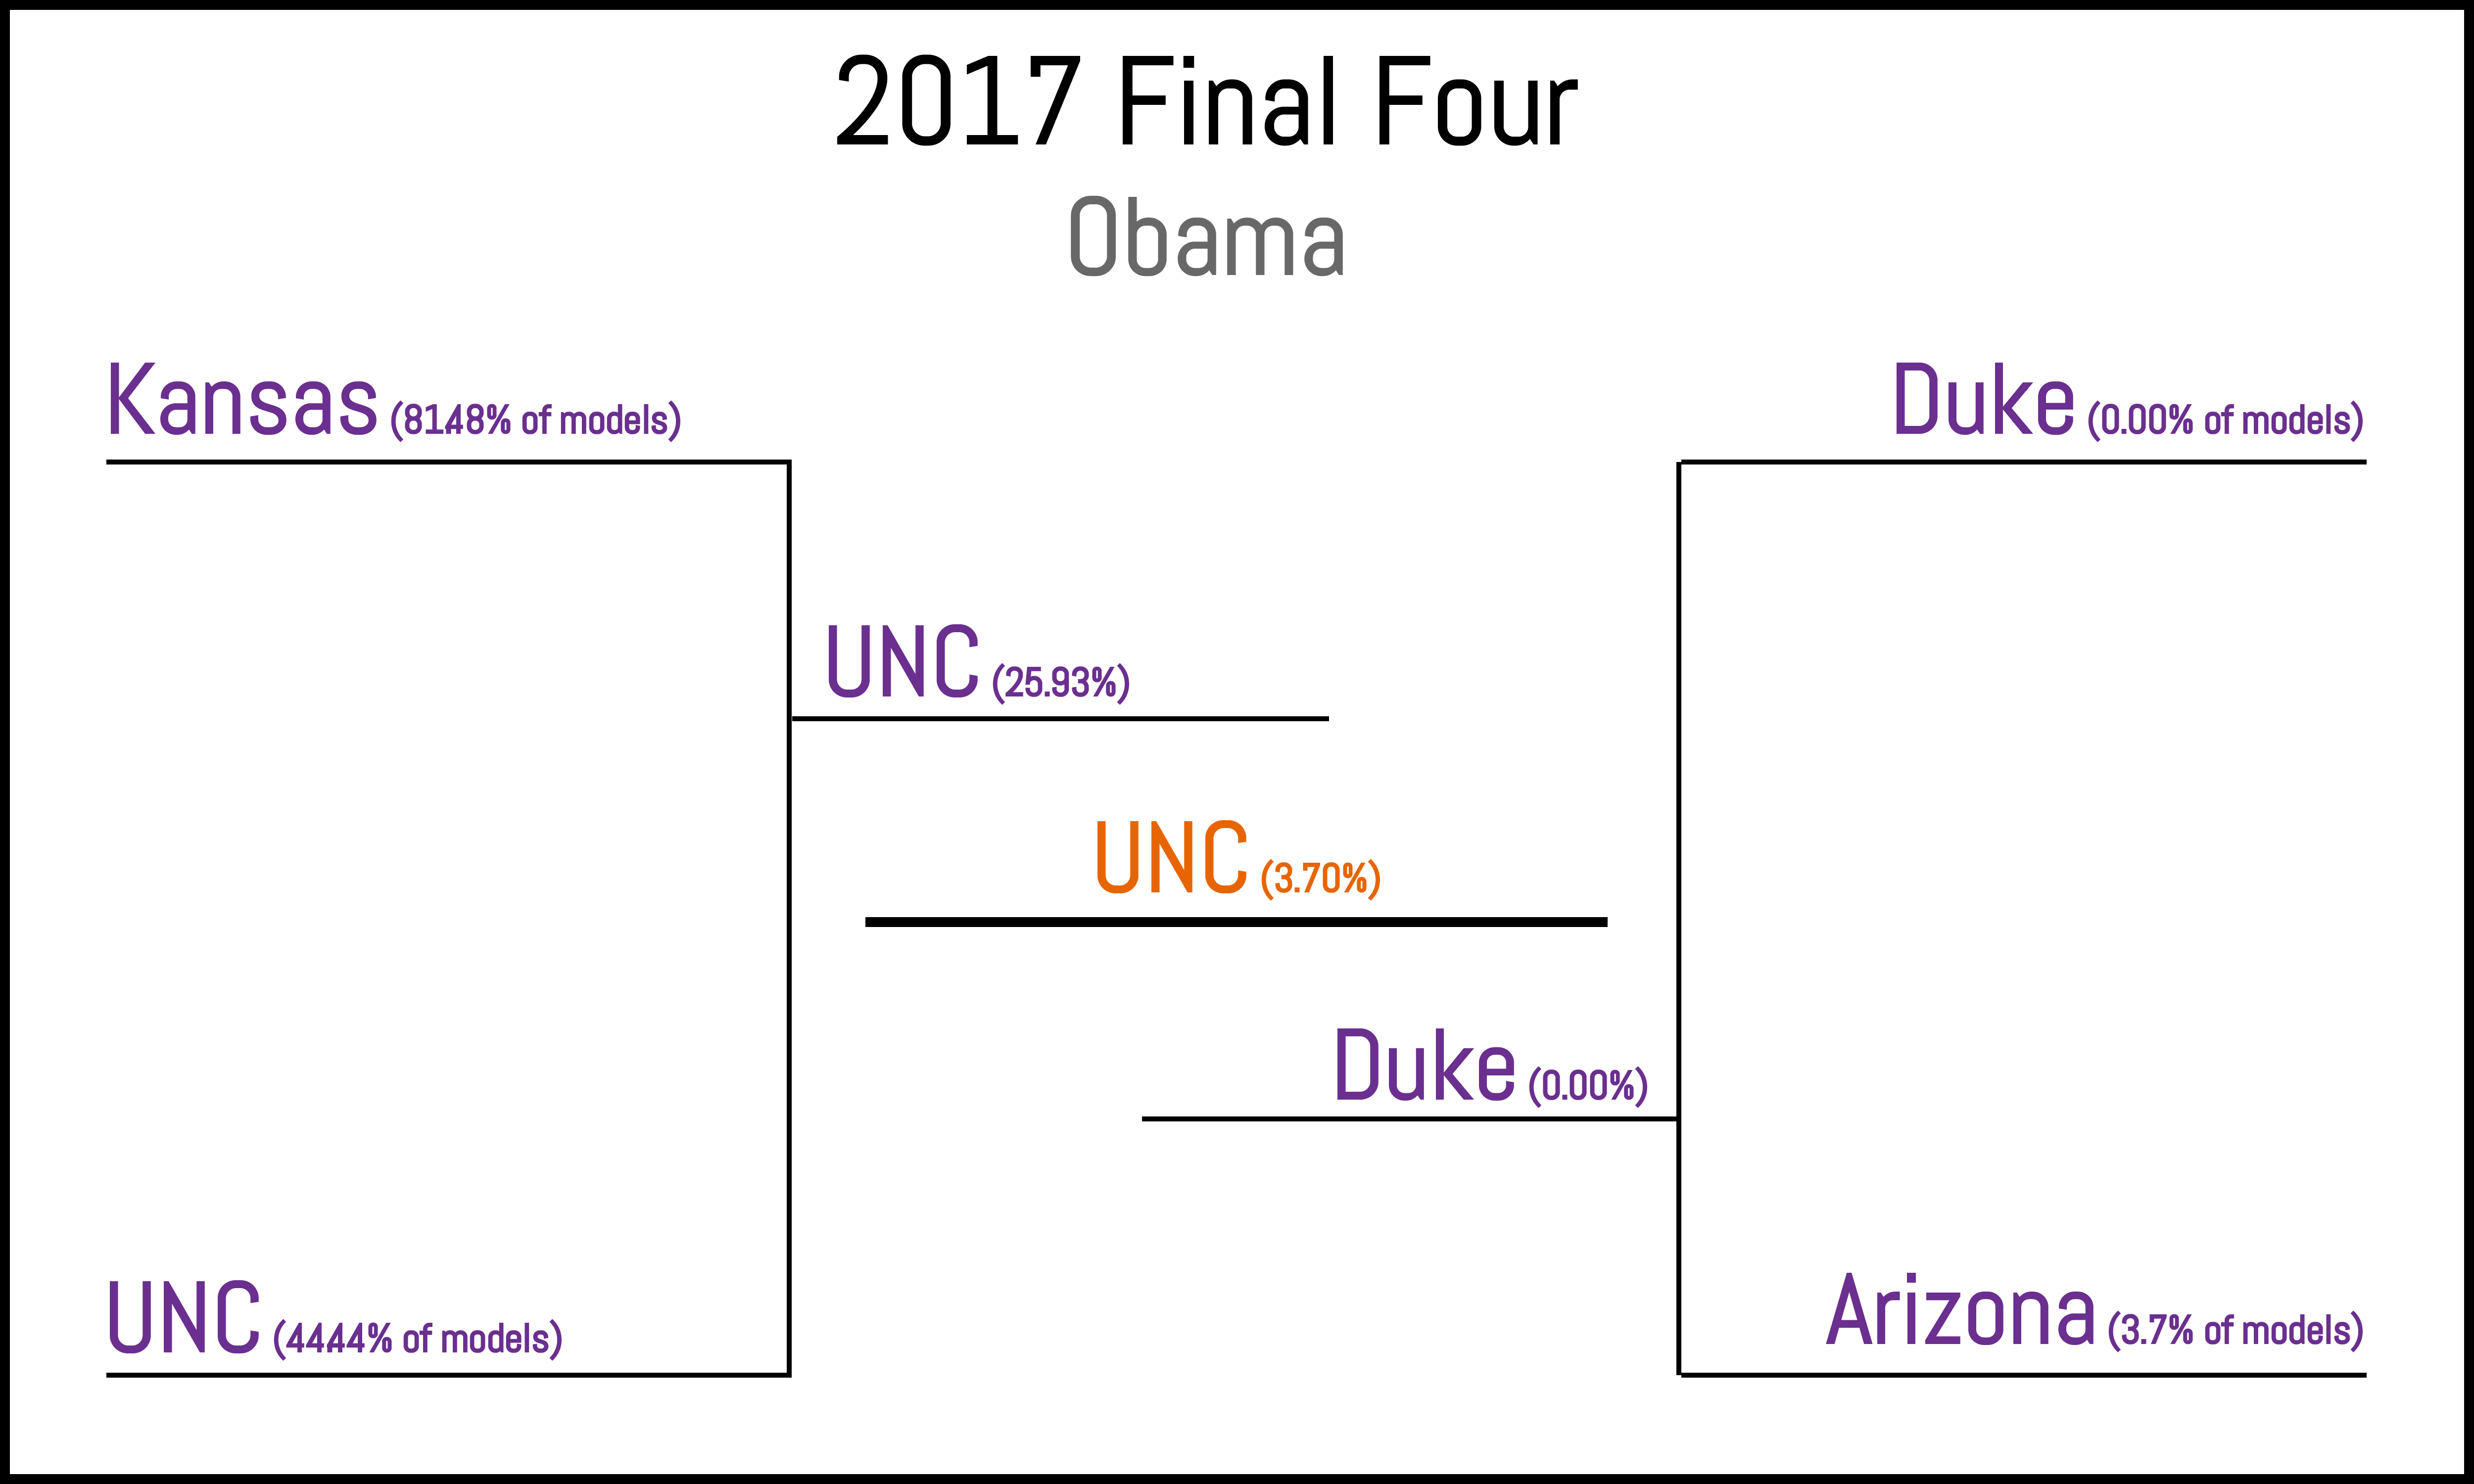
The Big O’s 2017 Final Four.

The Smart Money: Consensus
Before we add some noise to spice things up, let’s get an idea of where the consensus lies among standard models. Running the final 64 teams through 27 long-running models and computing the most probable final four outcomes yields the mini-bracket below (values show the percent of models that selected each team in each game).
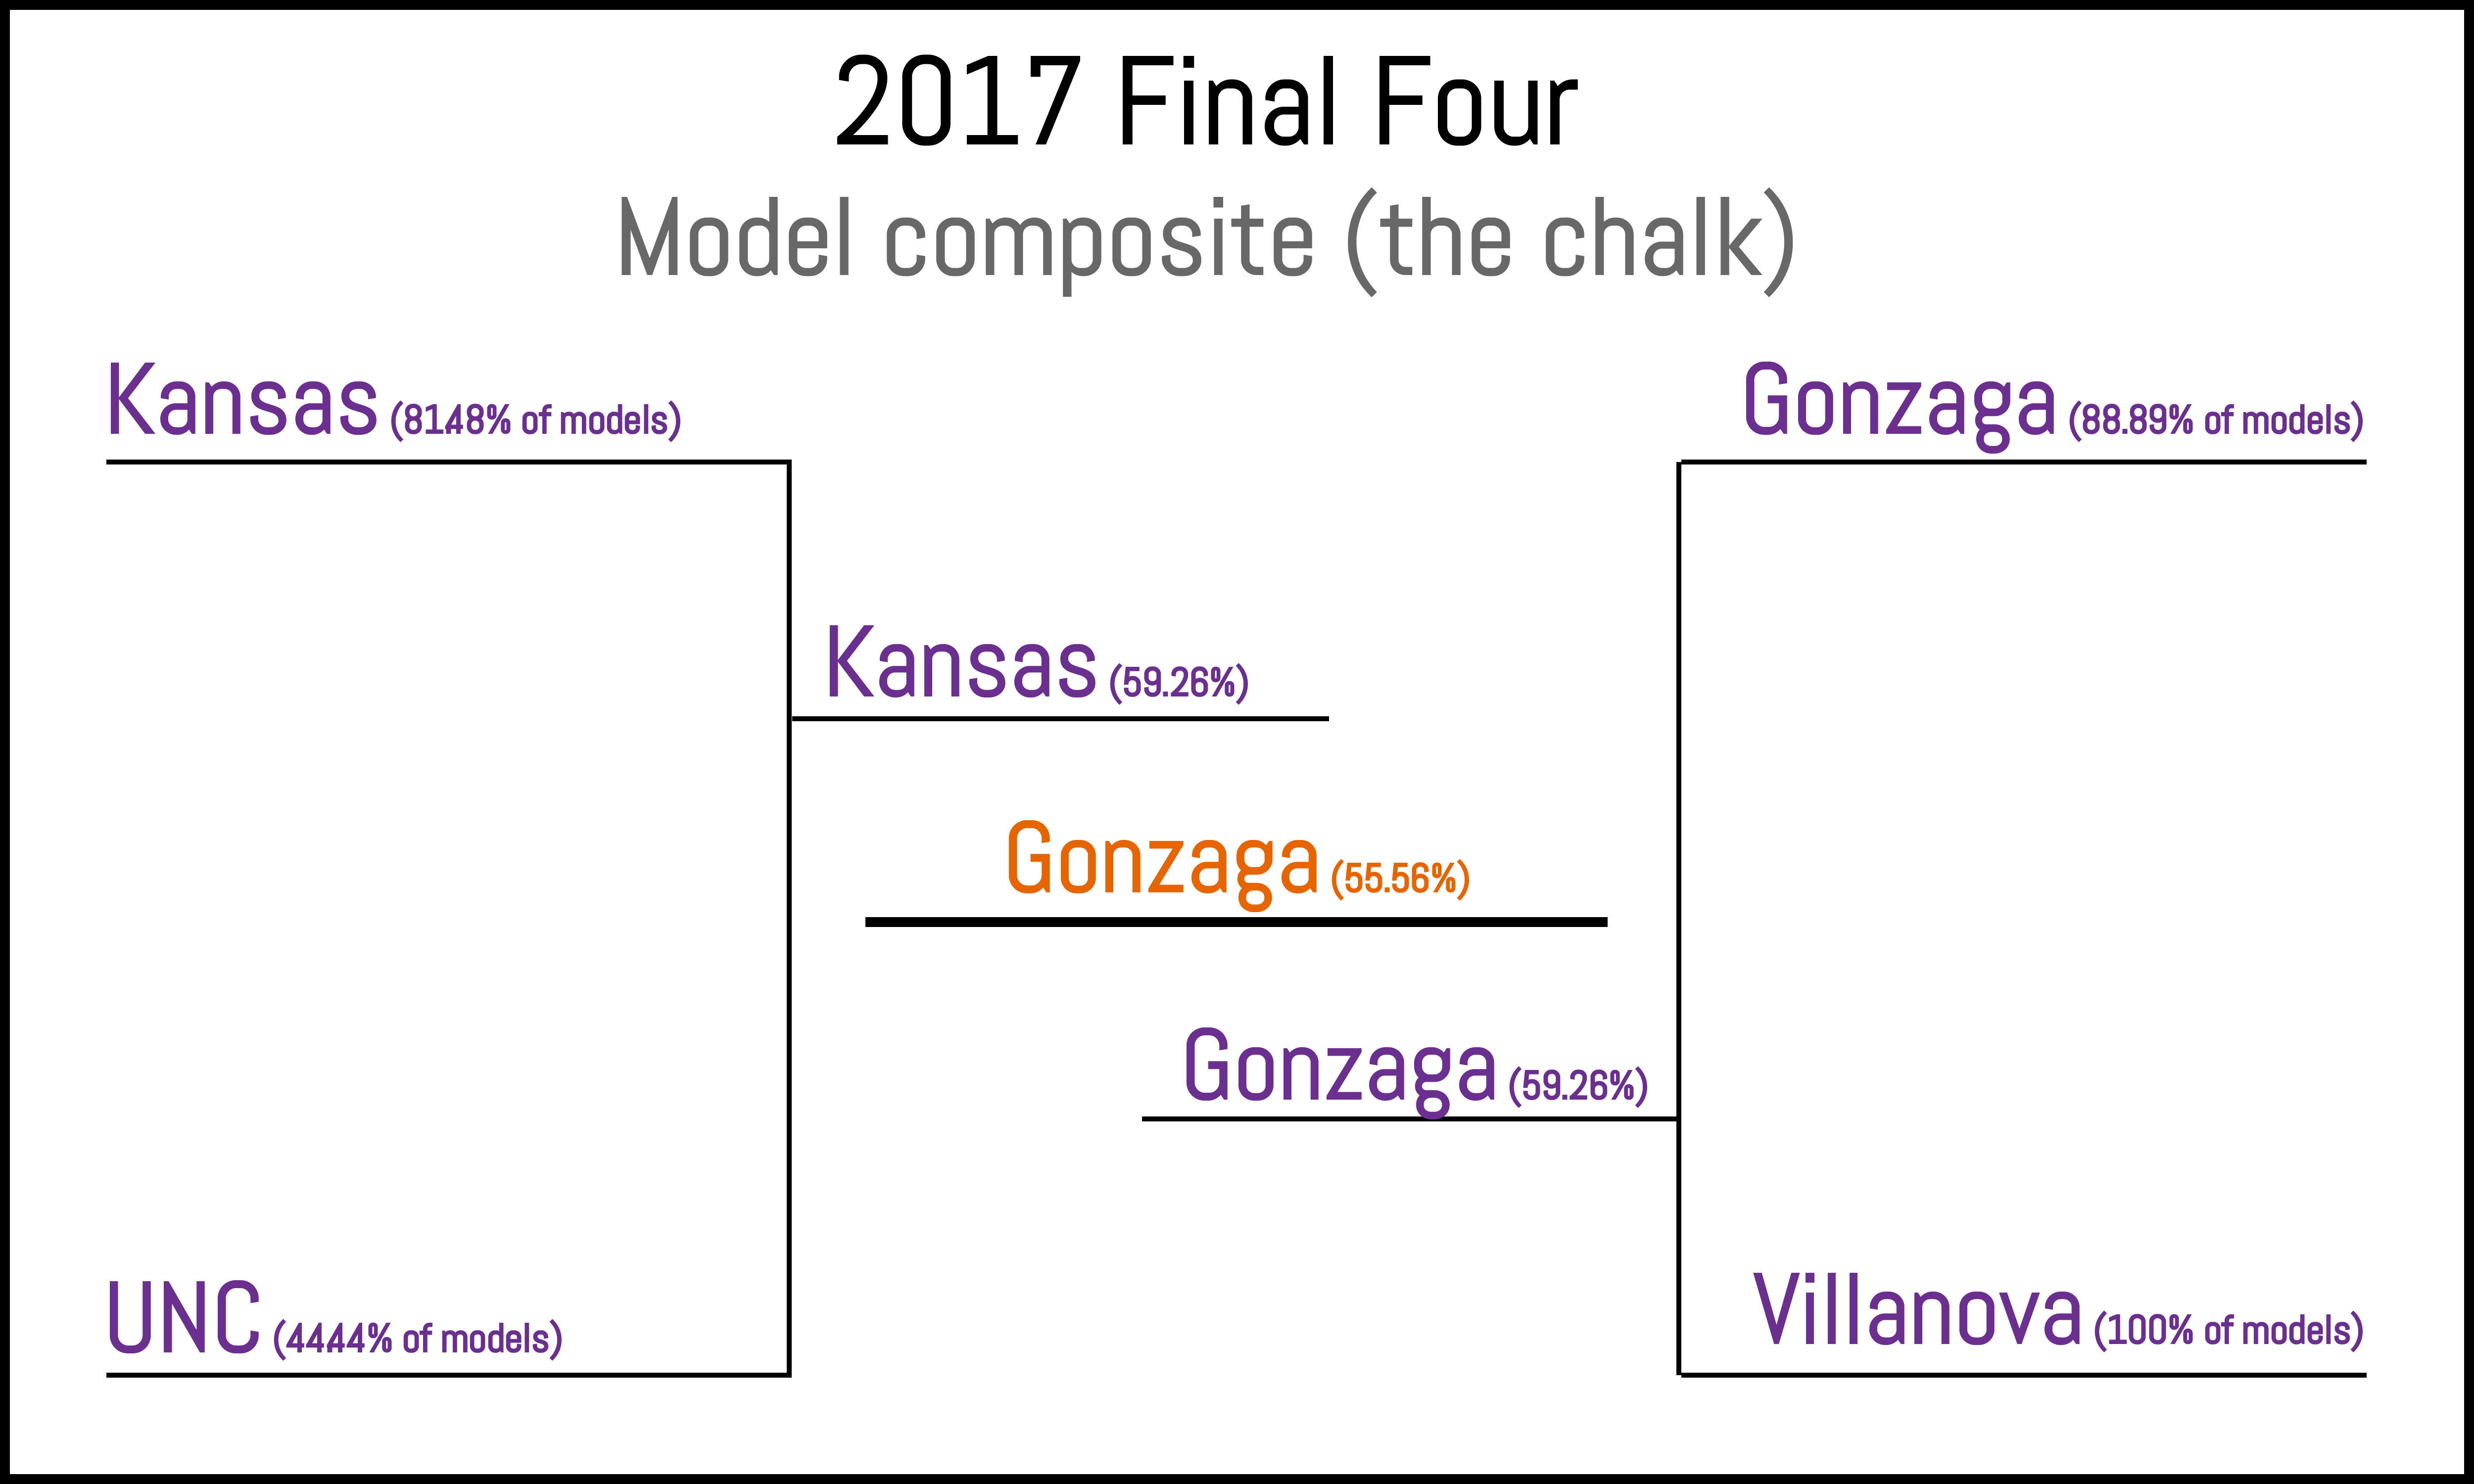
The average of all 27 models, which we’ll consider the chalk.
Mixing things up
To begin mixing things up we added normally distributed noise to the rankings. The amount of noise that maximized the upper range of bracket outcomes (the amount that gave you the best chance of owning your pool) was a standard deviation between 4 and 6. The Sagarin model had the best historical performance, so we added noise with standard deviation 5 to it and here’s where the really smart money lies (almost3)…
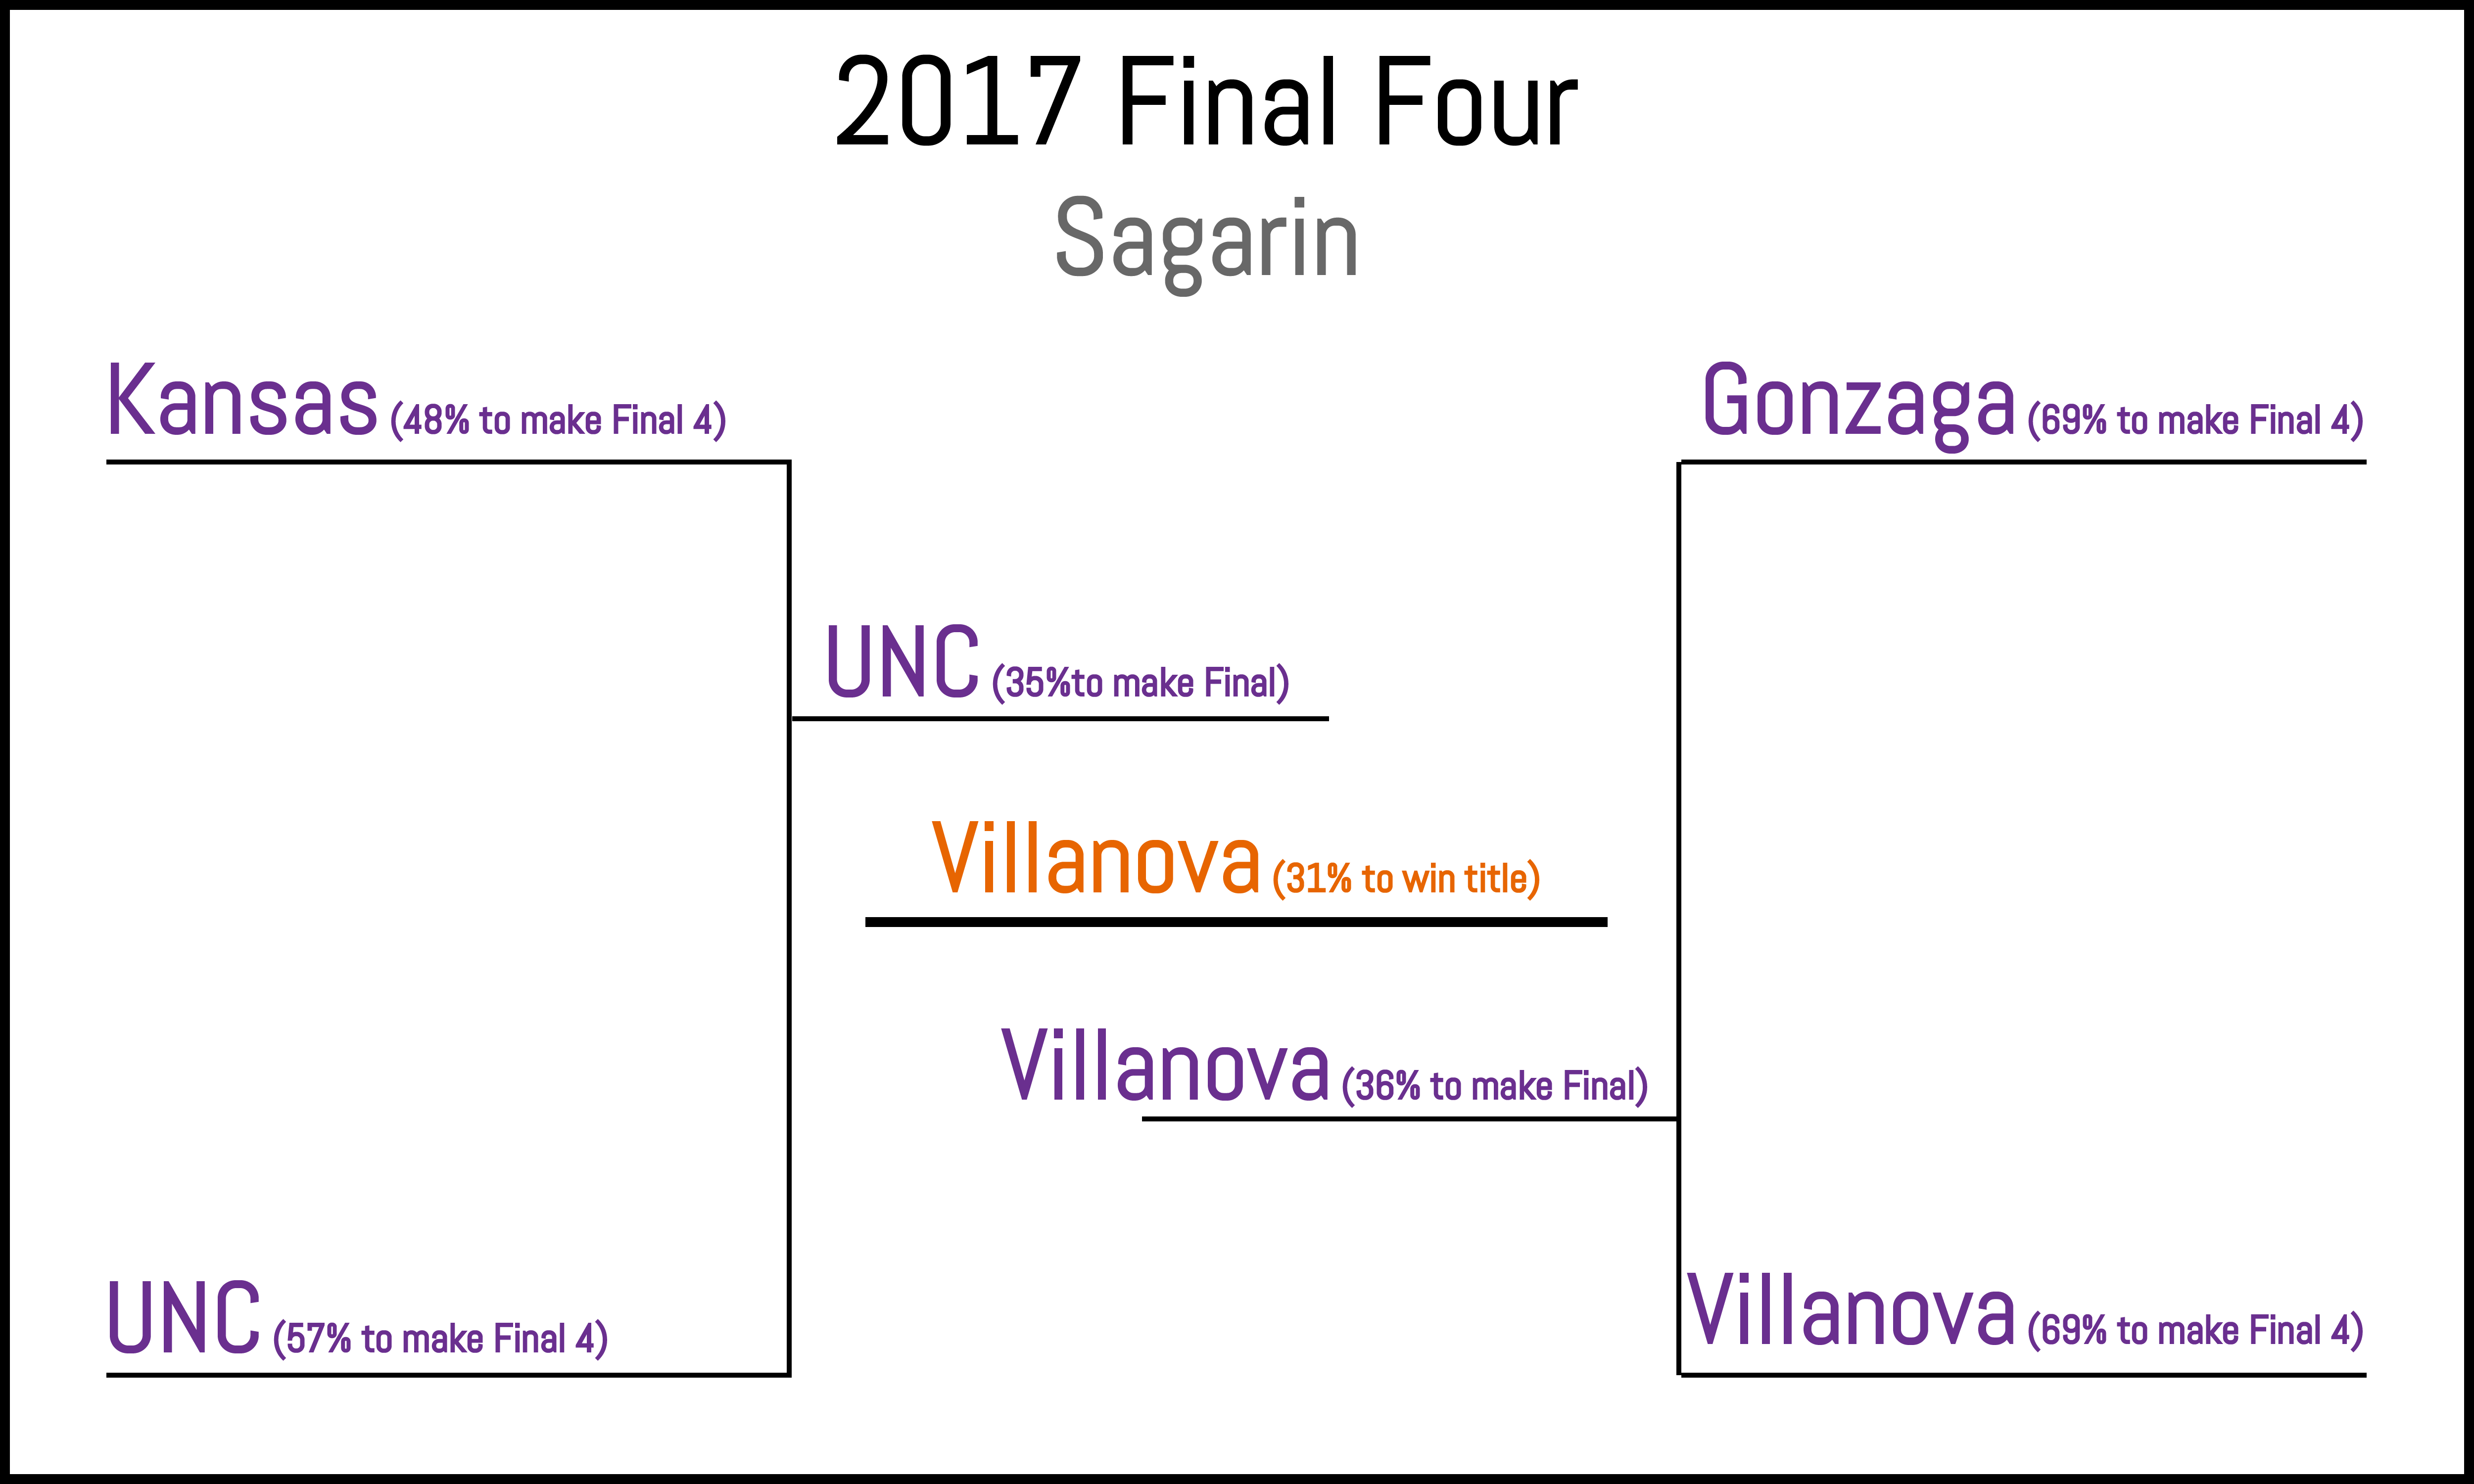
The Sagarin Final Four (the #1 model in the rankings).
And the not-so-smart but widely-published RPI…
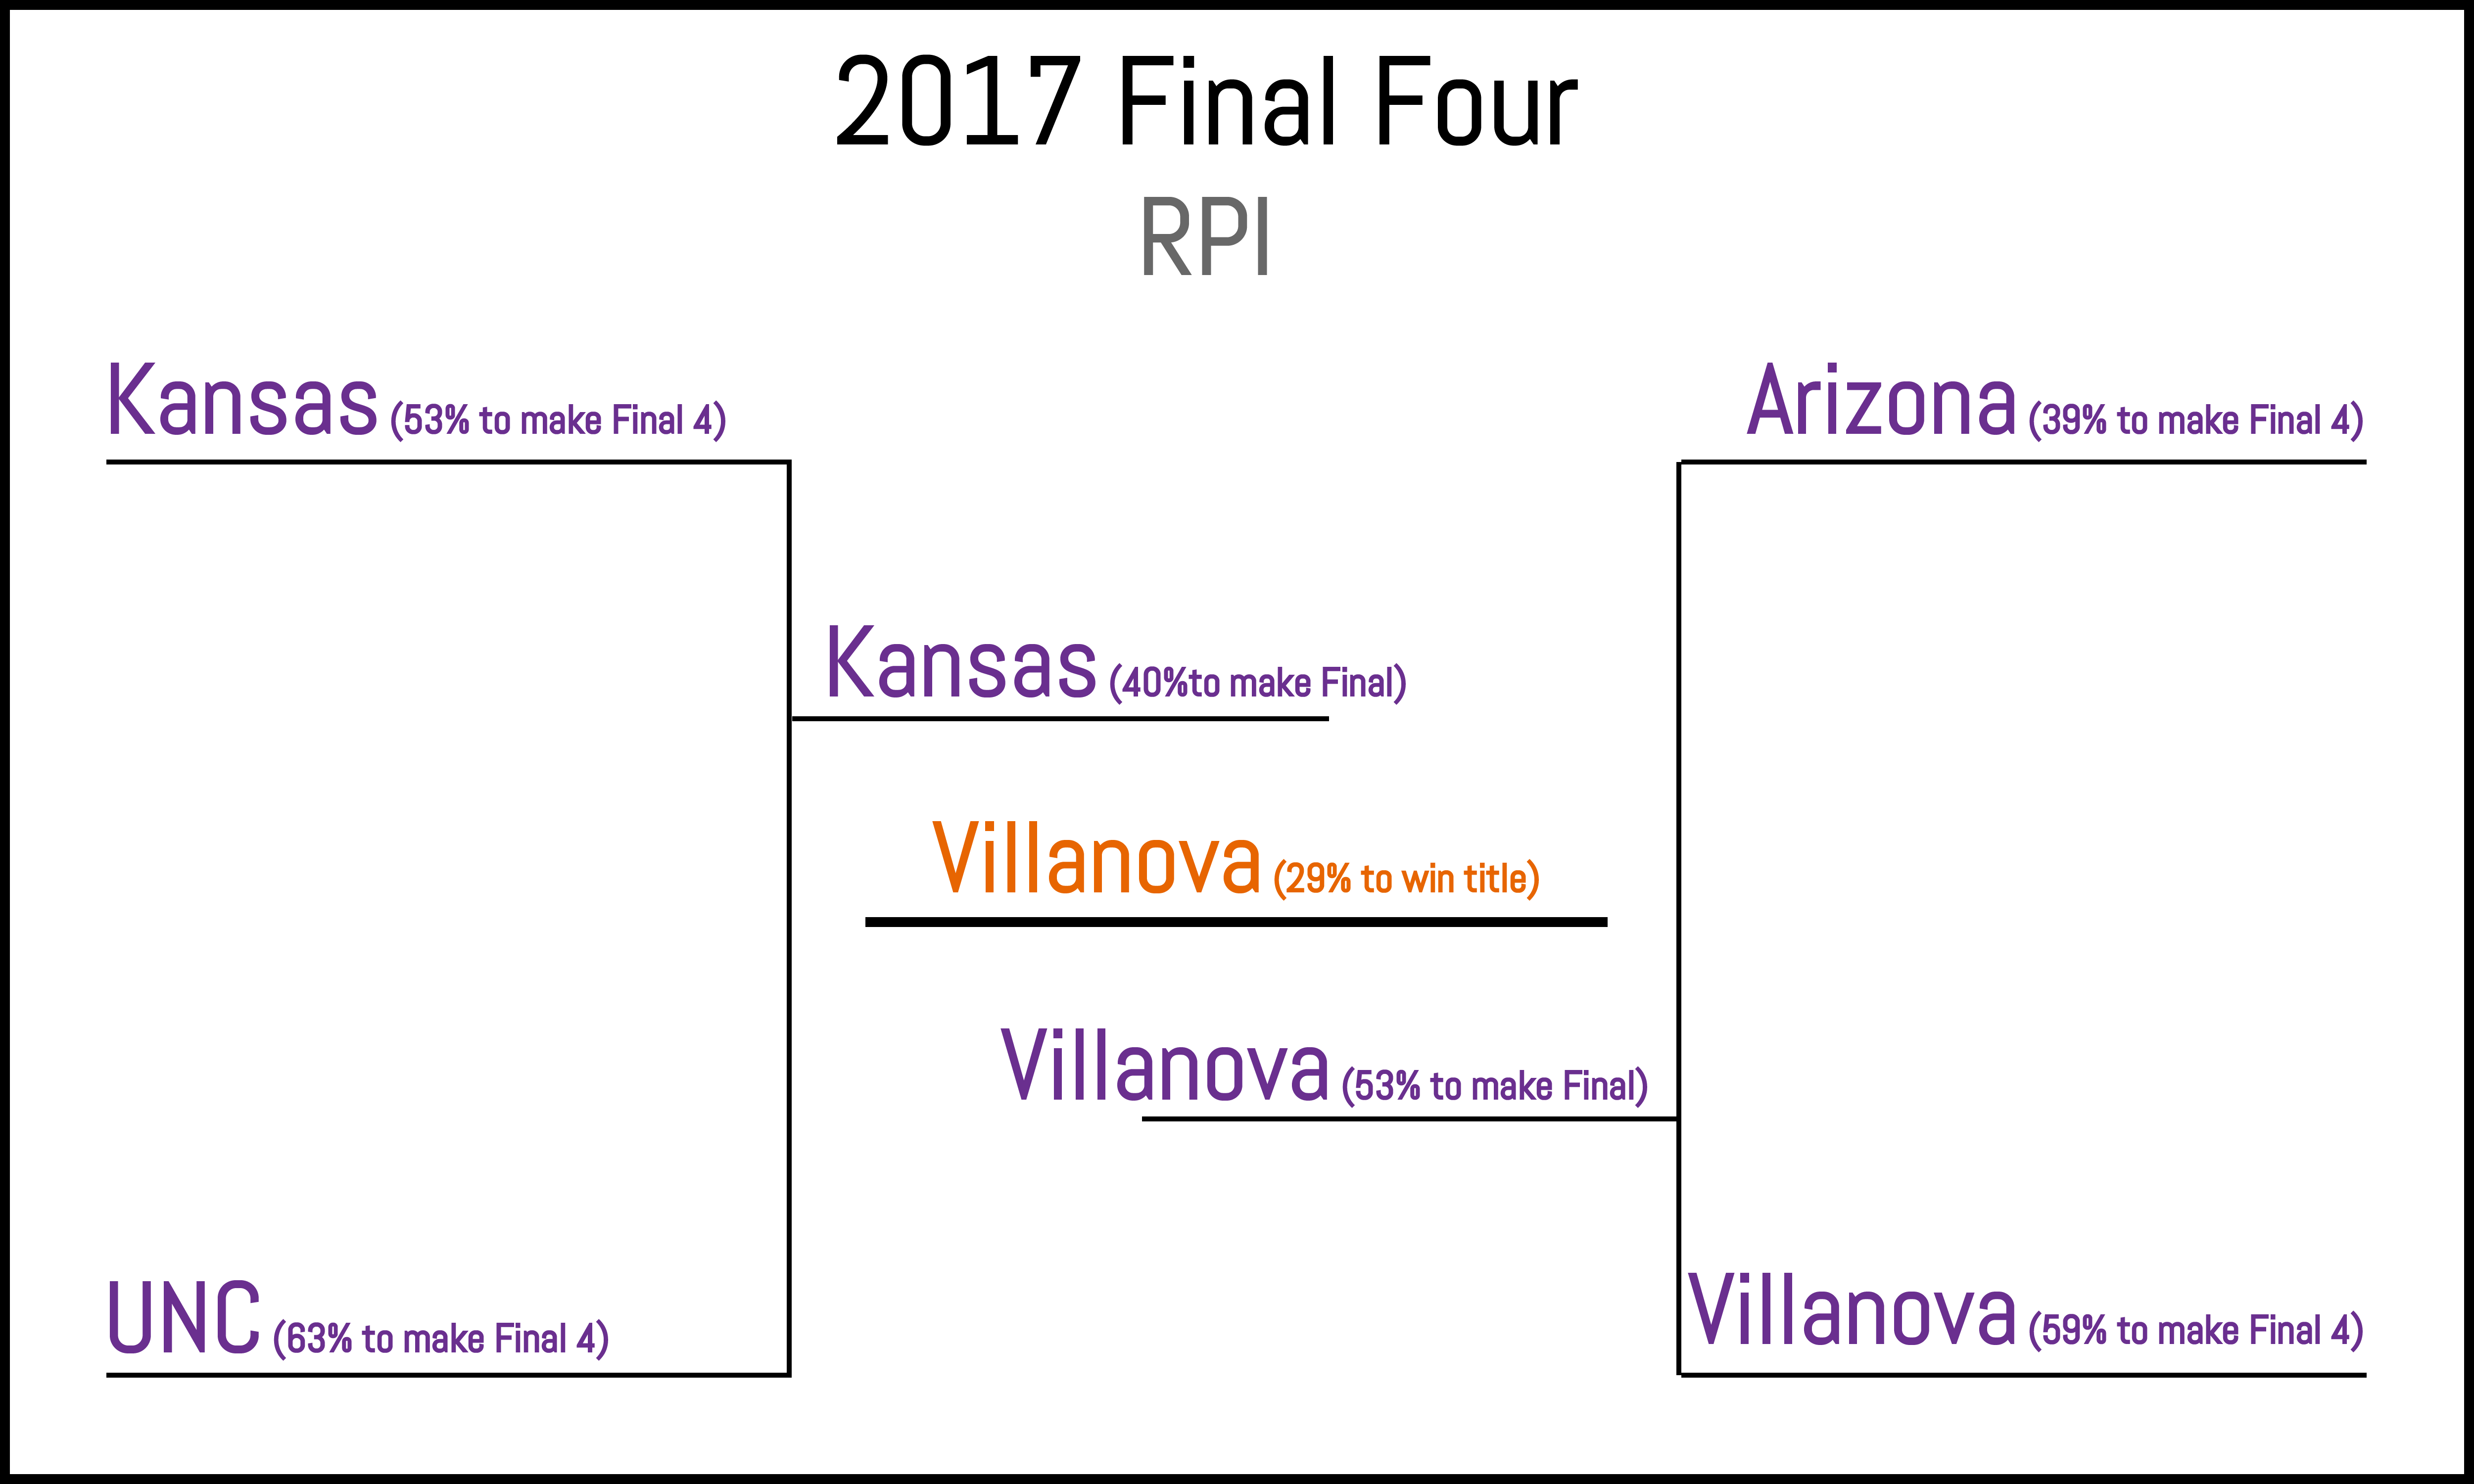
RPI, the worst-performing model in our set.
And now, time to get a little weird…
Since actual random noise is boring, we also used our exclusive mascot ranking to seed some uncertainty in the brackets. As before, the noise is normally distributed with standard deviation 5, however, the noise and the team are no longer independent. Awesome mascots like a shock of wheat, fierce amphibians, or animals with pluck are rewarded, while boring bulldogs languish at the bottom.4 The results are promising when added to the all-model composite…
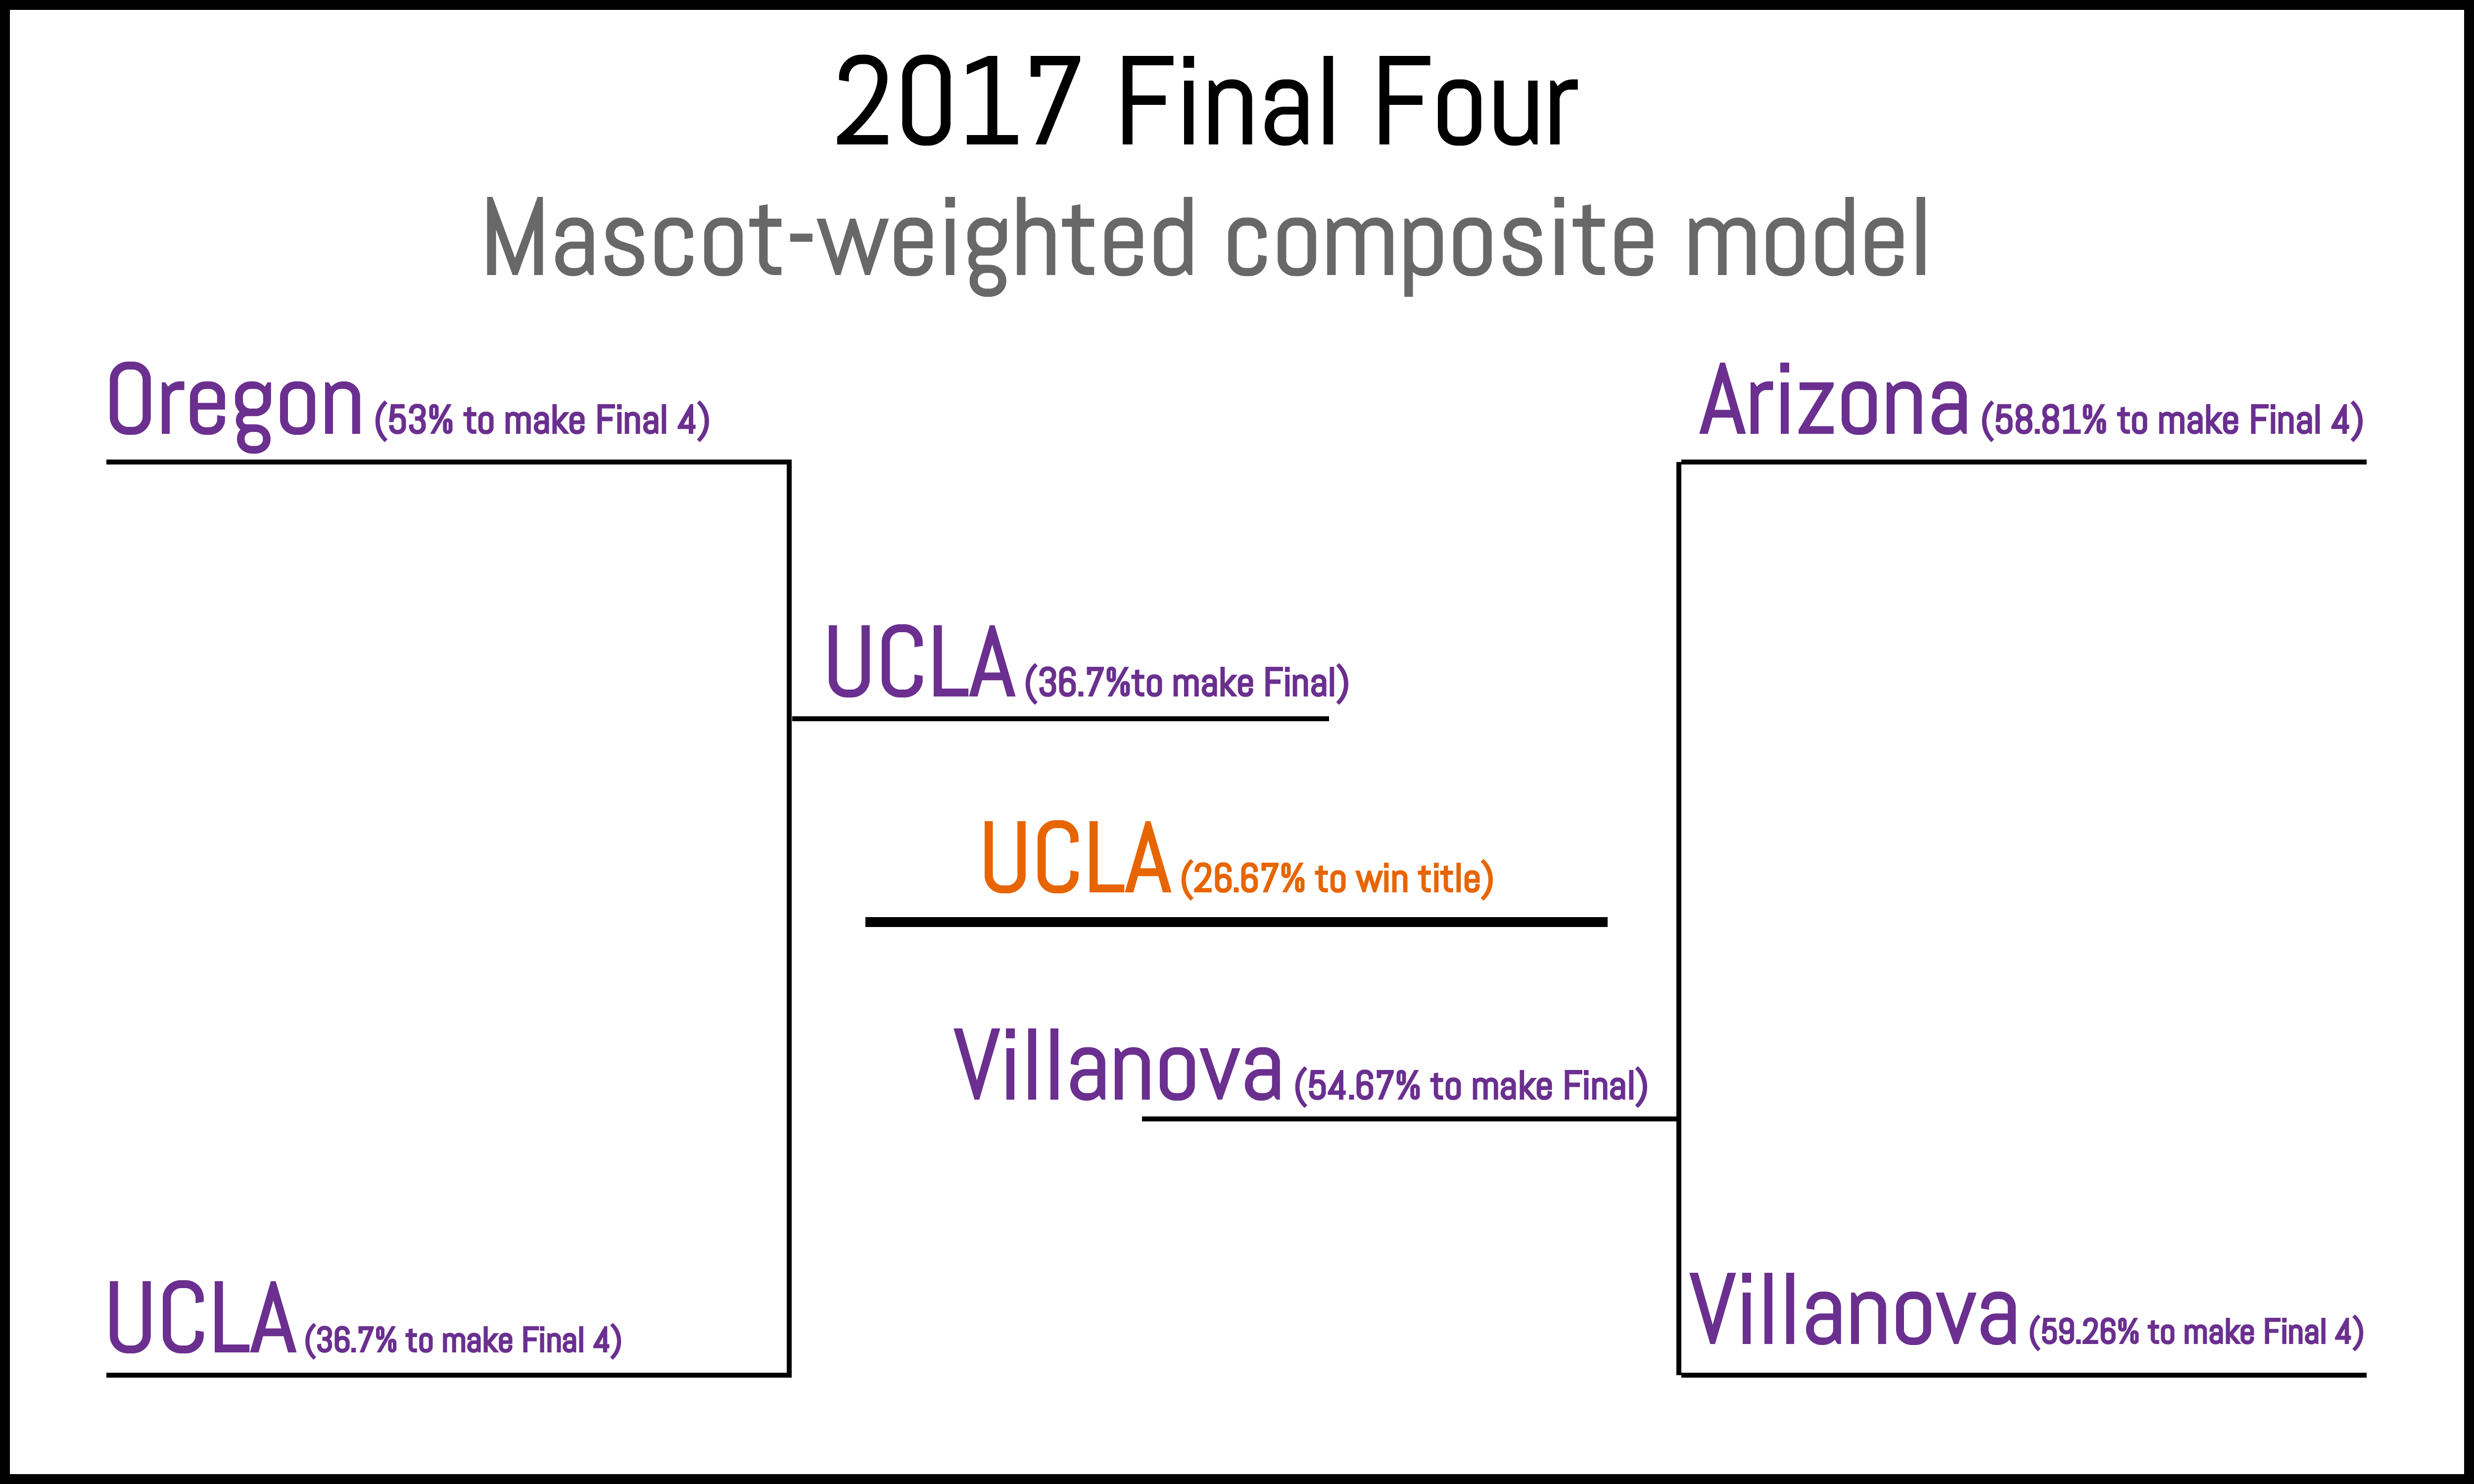
Mascot-weights adding some randomness to our composite model.
…but it still doesn’t fool Sagarin too much (Iowa state gets the big bump for being a force of nature, beating out the composite model’s plucky ducks)…
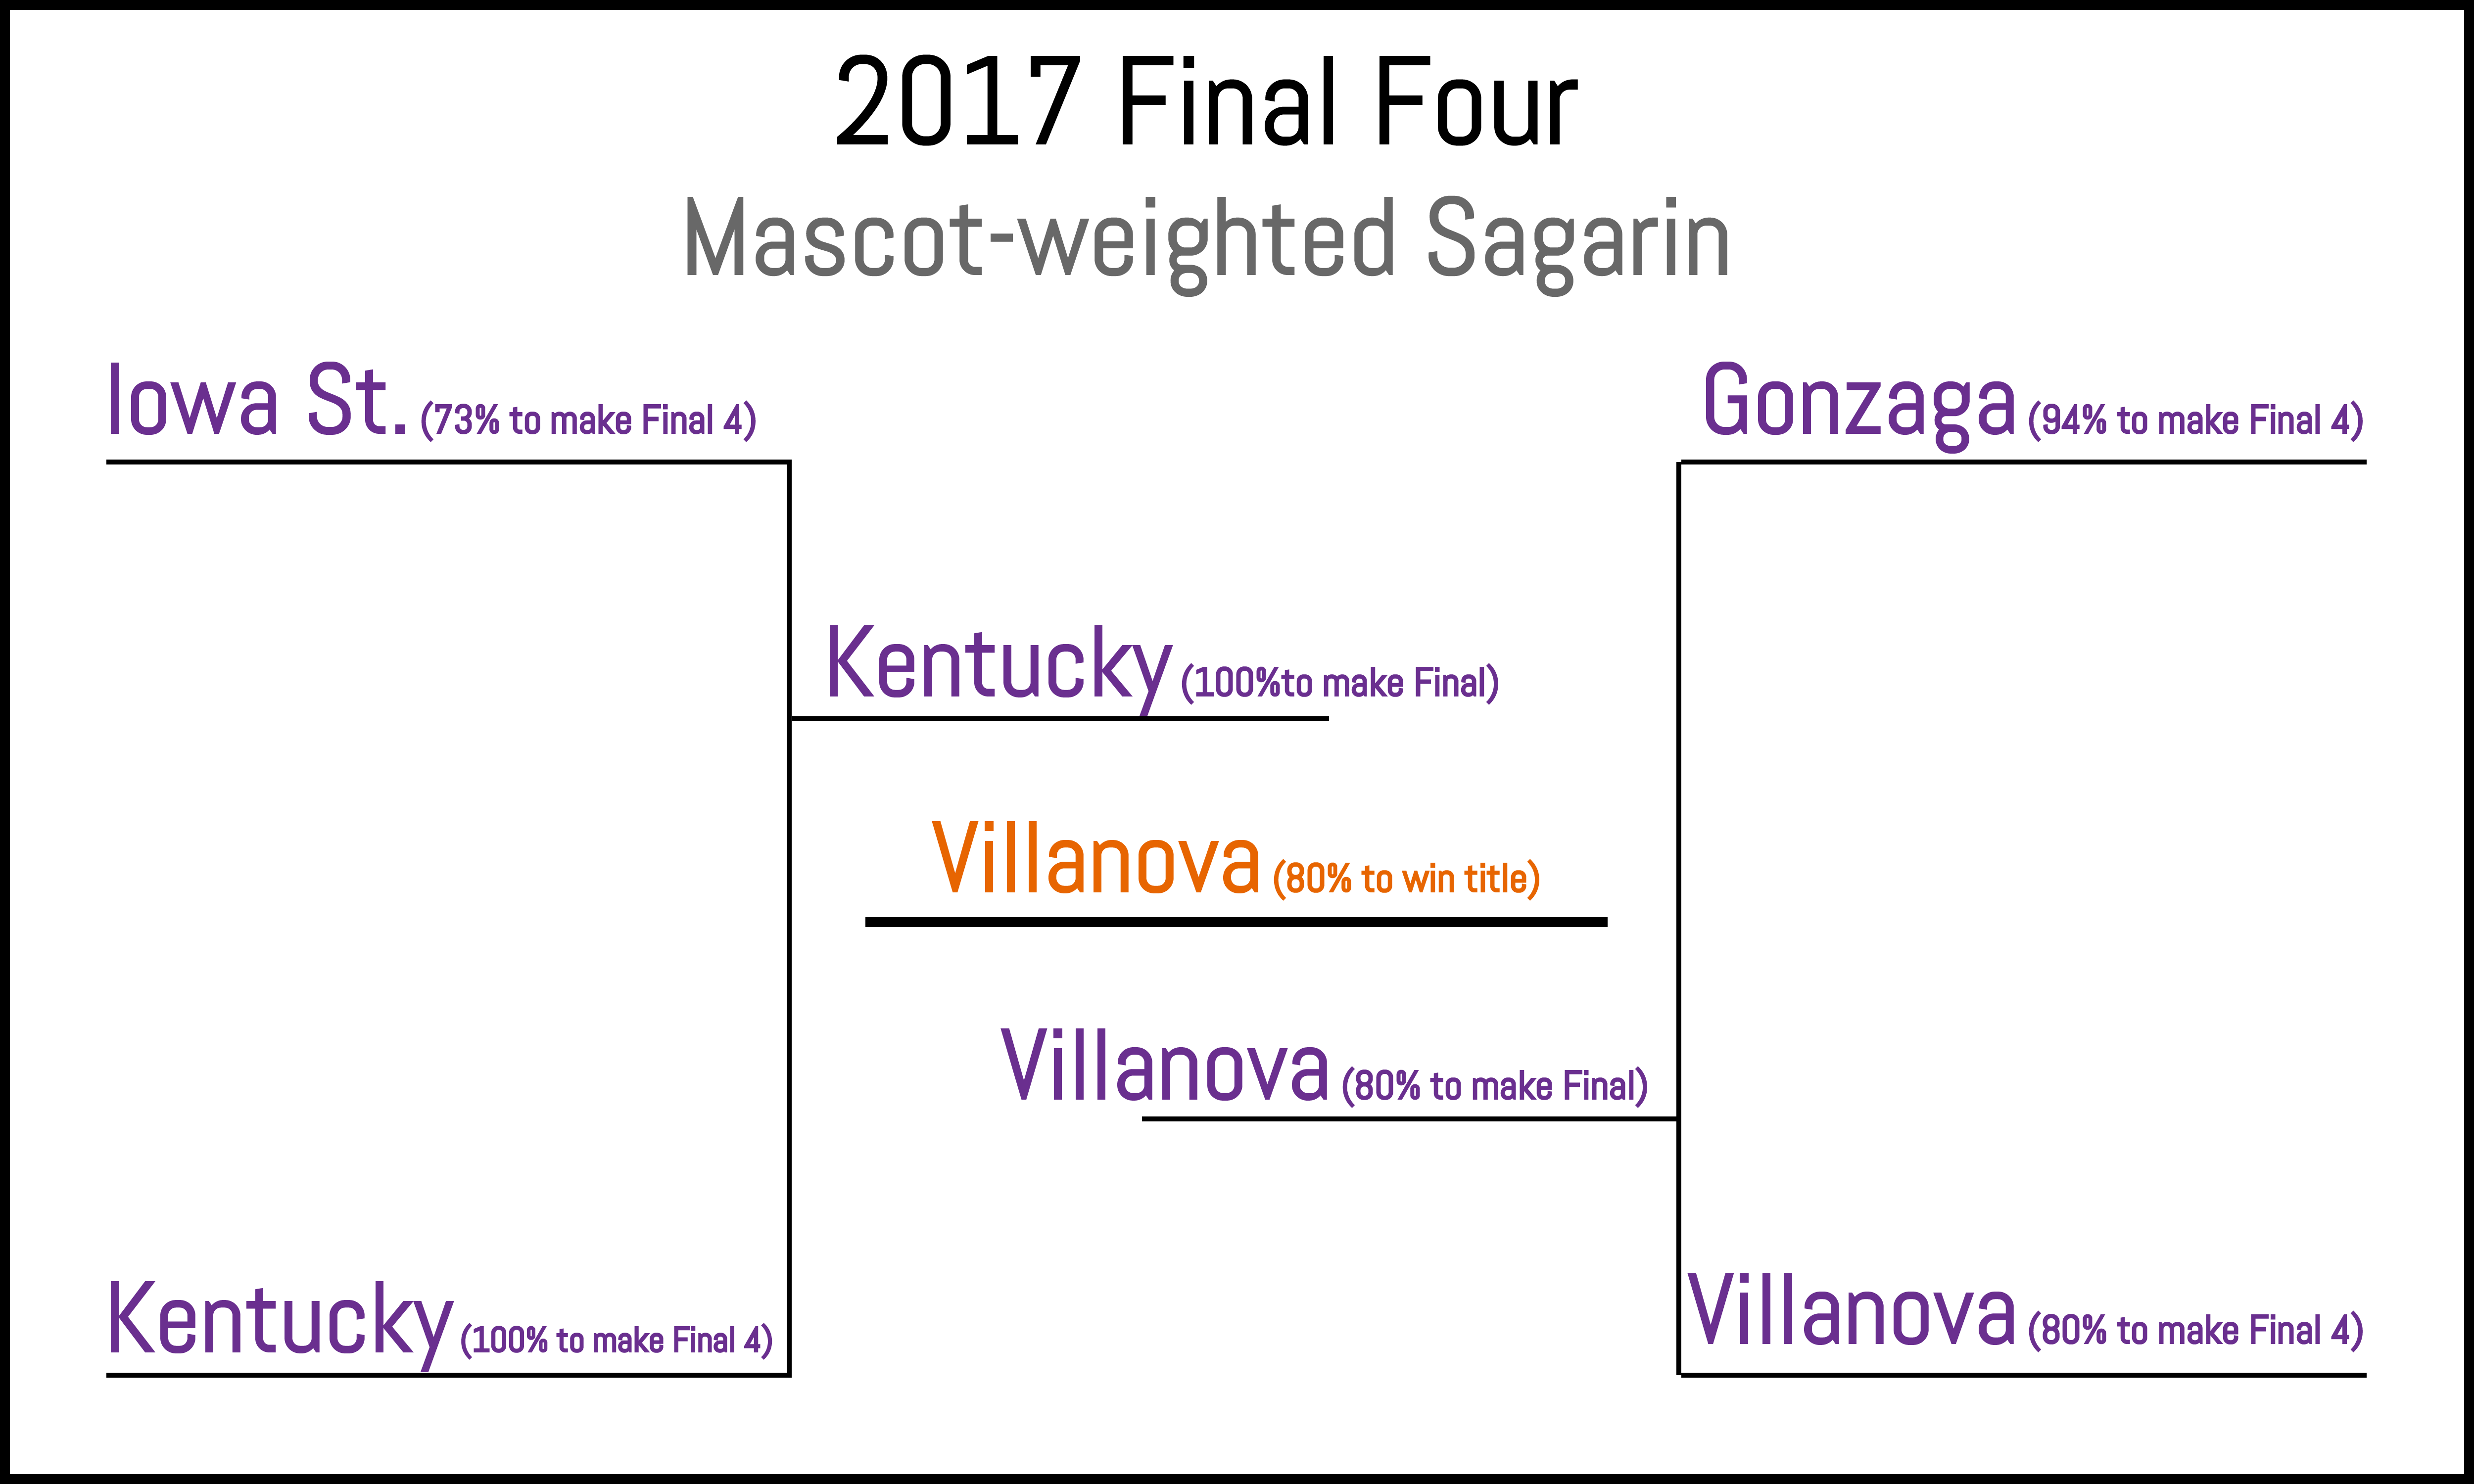
Sagarin is not impressed by your silly mascots.
Coming soon
We’ll track the performance of our models over the next several weeks and compare them to chalk to see if, indeed, we are able to reliably (well at least occasionally) come out on top. Or maybe this year will be bananas with upsets.
We either get to be right or have a lot of fun watching a 2011-esque tourney where no #1s or #2s make the Final Four. That’ll do.
1 My mouth was at The Bounty tonight having a beer, and my money headed to the bar pool there as well.^
2 The brackets are represented by a ranking. Each of the compressed files contains two columns: a team id (see teams.csv to get team names) and a number representing rank: lower is better.^
3 The SAG model without noise has Gonzaga going all the way, not Villanova. To be fair, our simulation with noise had Gonzaga a close second – if we ran it again it wouldn’t be surprising to have Gonzaga come out on top. It really is a coin flip.^
4 Sadly, even placing Bulldogs at the bottom of the list is not enough to overcome Gonzaga’s overwhelming advantage in round two against my beloved Northwestern. Sigh. Maybe next year.^
No Comments on "Applied Bracketeering: Modeling March Madness"