By: Patrick W. Zimmerman
Welcome to part 2 of the Beer Gazetteer, the project that seeks to help you answer that most paramount question: Where’s all the good beer at? And how do I drink it? In part 1 of the project, we built the dashboard and introduced some of our research questions. It’s pretty and fun. There are colors, you can zoom in and stuff. Pick out your favorite zip codes. There are numbers; it feels sciency and such. Excellent!
So what? It’s great to blow a few hours at work taking a little tour of the US, but what else can we use it for? Ranking and recommendations, that’s what!
It’s a map. What do you do with maps but use them to figure out where to go! If you love beer (and, if you made it through part 1, there’s 87.382791%1 chance you do), then the logical conclusion is to use this Gazetteer to sort the United States in to haves and have nots, shining Craftopias and barren wastelands of The (Anheuser) Bush.
Feeling like sipping a little Schadenfreude with your beer? Say you’re more interested in celebrating the best and more up for pointing at the worst and chanting “Shame. Shame. Shame.” Never fear, I’ve got you covered. Just pop on over to Beer Gazetteer No 3: The loneliest, least beertastic metro areas in the US and mock away.
The Question
What American metro areas have the highest concentration of fantastic breweries?
The Short-Short Version
If your sole criteria for a happy home is to be surrounded by a bajillion different high-quality brews at all times, then you need to move to the Northeast or Southern California. The density of population, and of amazing breweries, cannot be matched by any other region of the US. If you care about how much you pay for said beer….it’s pretty much the same answer, though coastal Florida also becomes appealing.
Not the answer you were expecting? Me, neither.
The Basic Booze Index
Or: The Beeriness of US Combined Statistical Areas, in convenient graph form.
Of the set of 30 metro areas, only 4 manage to be both above average in both the quality and quantity of nearby breweries. That’s a surprisingly low number, actually. For comparison, 17 of the 30 metro areas manage to be better than average at either the quality or amount of beer available, and the remaining 9 stink on both measures.
So, without further ado, here’s our Fab Five: Boston, New York, Philly, LA, and San Diego.
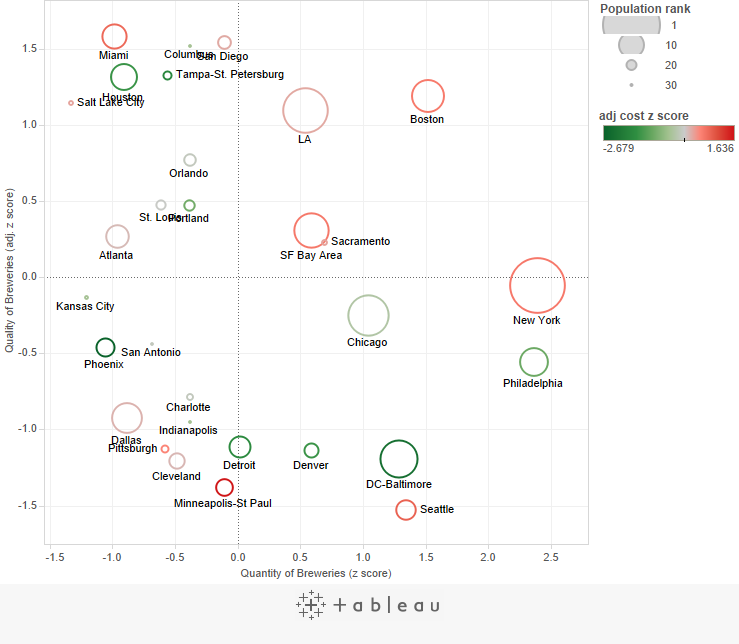
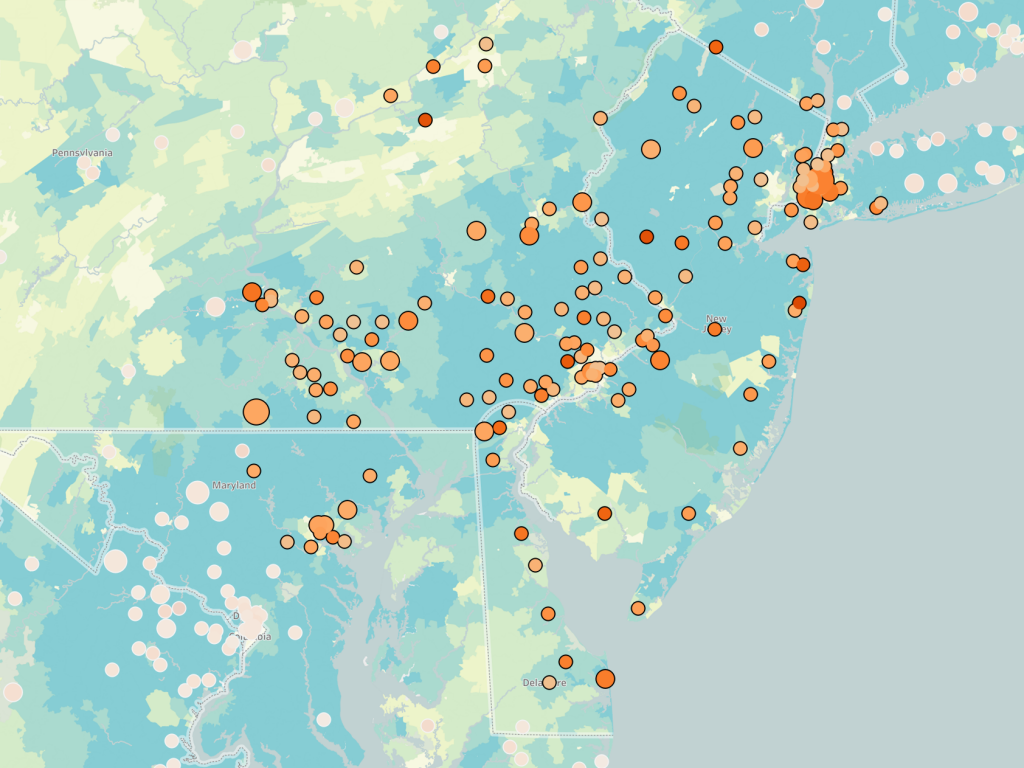
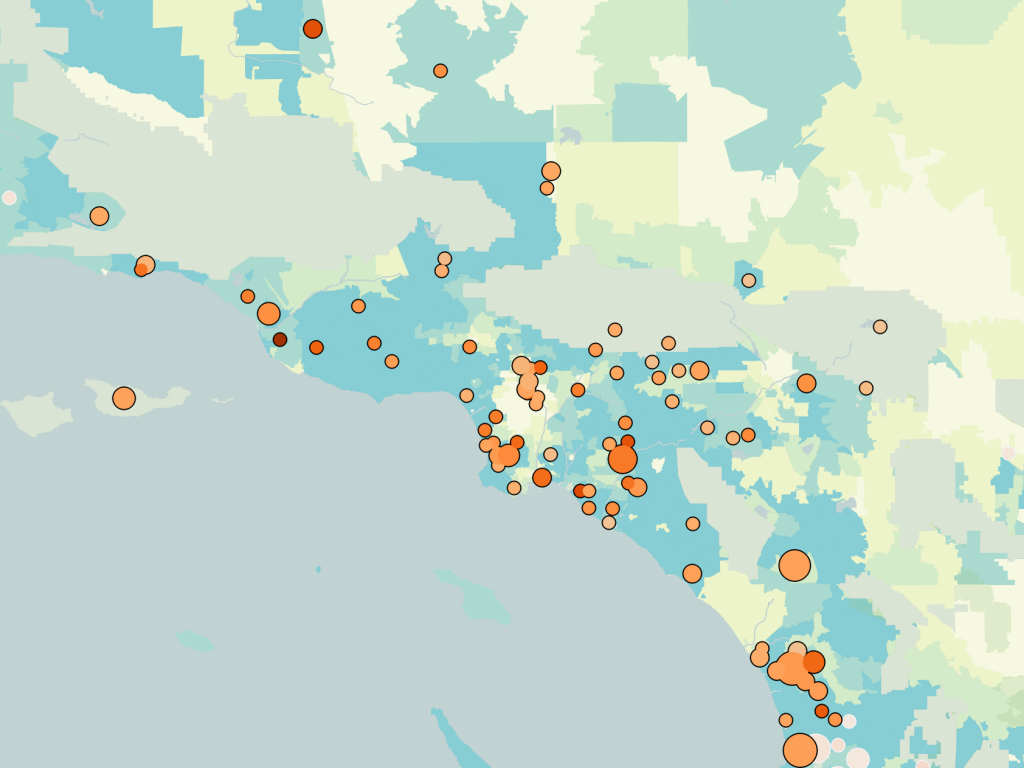
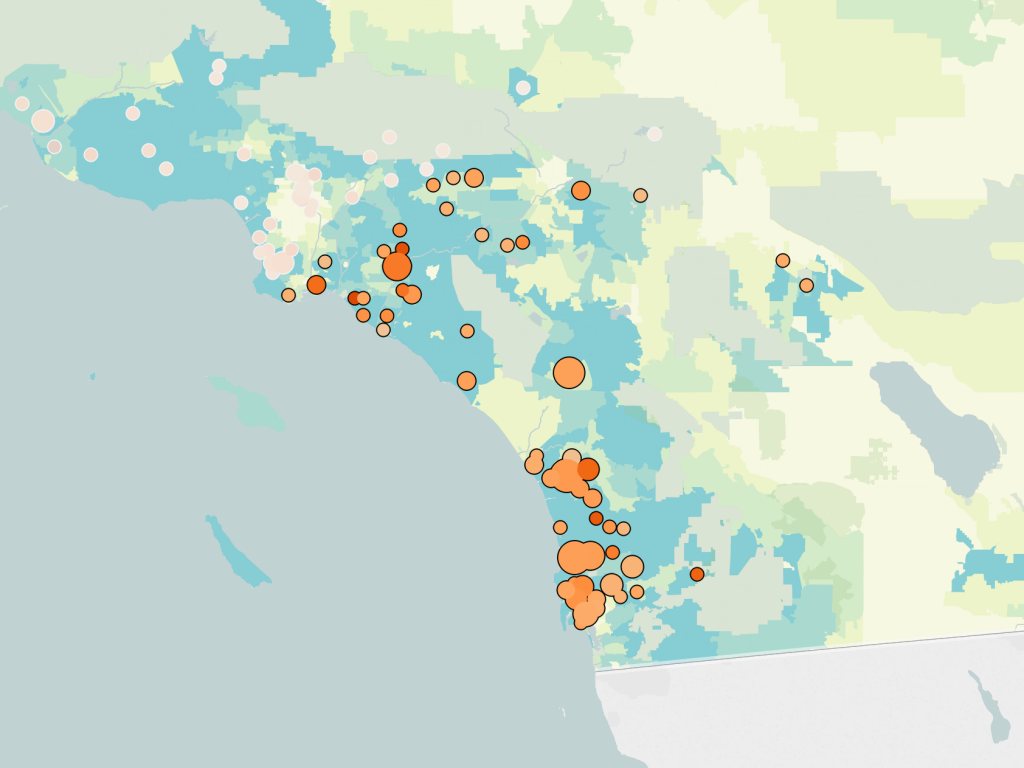
Click image for interactive dashboard.
The size of the bubbles indicates population. Coloration is cost of Food & Beverages in that metro area (green is cheap, red is expensive).
#1 – Boston
Basic Booze Index of 271.0
Boston, the great beneficiary of being juuuuust under 100mi from Portland, Maine, and thus (possibly) cheating a wee bit.
Boston is mildly expensive (+0.96 z-score cost), but it has both a lot of breweries within its radius (120, 3rd most). It’s secret sauce, though, is having far and away the highest number of superlative breweries in the US, with 17 (next is New York with 13, and there are 7 metro areas with a single solitary brewery that tops 4.0 out of 5).
Well done, New Englanders. Well done.
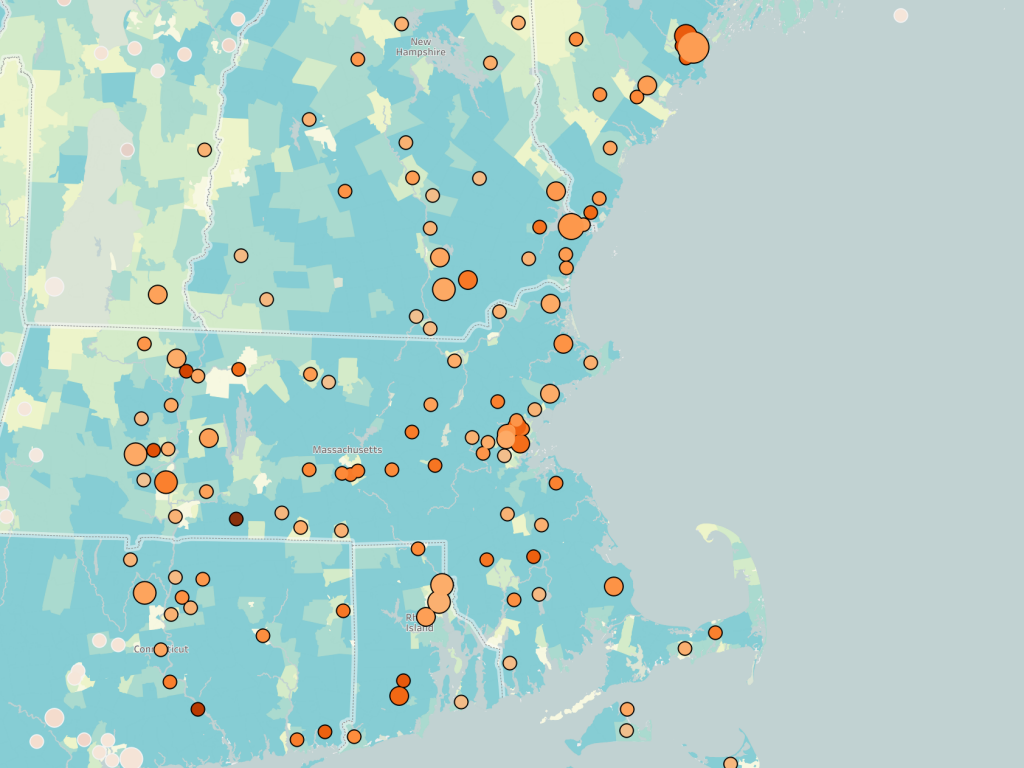
Click here for interactive dashboard
#2 – New York
Basic Booze Index of 233.8
New York, in beer as in other domains, wins on size. It’s the biggest, baddest, boldest, and most obnoxious. In spite of a middling (relative) quality of available ales (-0.1 adjusted quality z-score), New York’s 155 qualifying breweries within a 100 mile radius propels it into the #2 spot. If cost of housing (and sharing your beer with millions of other people) doesn’t really bother you, New York is your spot.
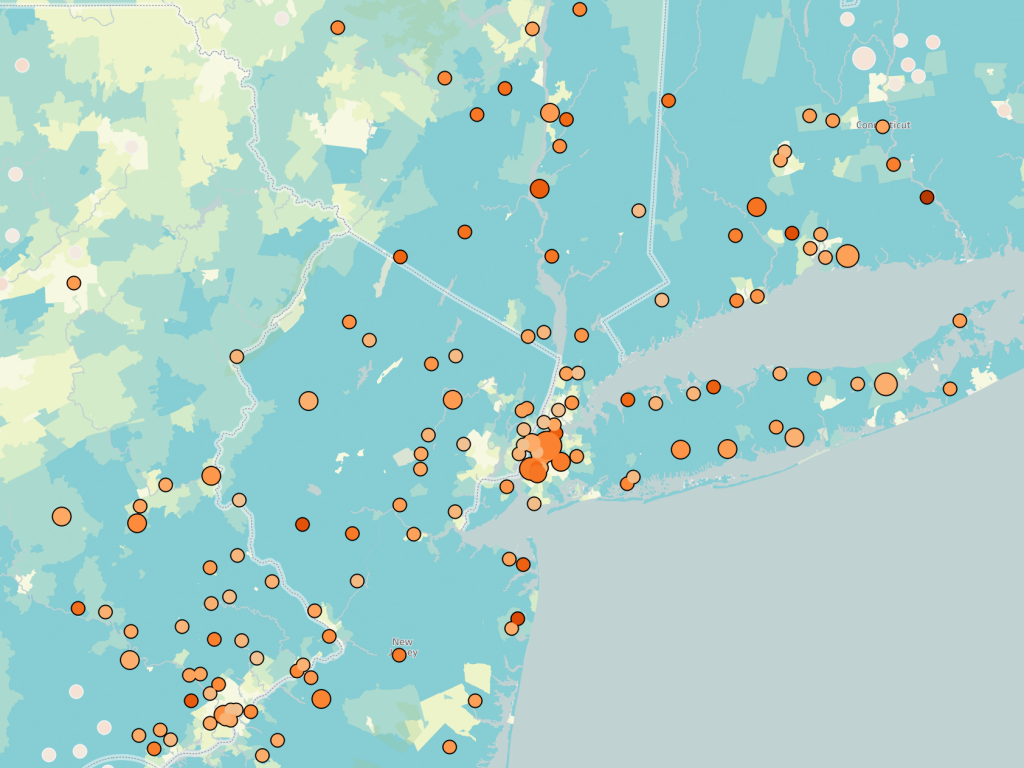
Click here for interactive dashboard
#3 – Philadelphia
Basic Booze Index of 181.2
While overlapping a fair amount with New York’s dataset (Hi, New Jersey!), Philadelphia also looks good primarily due to its volume of good (not great) breweries, with 153 breweries nearby.
Beer with your cheesesteaks? Yes, please. American with. Hots and sweets.
Click here for interactive dashboard
#4 – LA
Basic Booze Index of 164.0
Los Angeles is not a name that most people would guess would be near the top of the heap, but the City of Angels beats out Left Coast rivals up the coast. San Diego, Portland, San Francisco, Seattle? Try again. All those cities do well, but if beer is your primary criteria for paradise, then you could do worse than settling on the West Side. Or Riverside, for that matter.
Click here for interactive dashboard
#5 – San Diego
Basic booze Index of 143.5
San Diego earns the distinction of being the only metro area outside the top 10 that makes it into the top 5 beer cities. It deserves some serious credit for not primarily winning due to the concentration of potential drinkers. Its 55 breweries rank 2nd2 with an adjusted quality z-score of +1.5, including an impressive 9 superlative (4+) breweries. Beer also is the perfect pairing for fish tacos, and if you’re in San Diego, you’re going to want to stuff your face with both. Constantly.
Here is a city punching well above its weight (18th in population). You stay classy, San Diego.
Click here for interactive dashboard
The List
Or: The top 5, in table form, for the less graphically inclined among you.
| Combined Statistical Area | Basic Booze Index | Adj. Booze Index | # breweries | Superlative breweries (≥4/5) | population rank | z-score quantity | adj. z-score quality | adj. z-score cost |
|---|---|---|---|---|---|---|---|---|
| Boston | 271.0 | 95.9 | 120 | 17 | 6 | +1.5 | +1.2 | +0.6 |
| New York | 233.8 | 80.6 | 155 | 13 | 1 | +2.4 | -0.1 | +0.6 |
| Philadelphia | 181.2 | 93.3 | 154 | 10 | 8 | +2.4 | -0.6 | -1.0 |
| Los Angeles | 164.0 | 60.6 | 81 | 11 | 2 | +0.5 | +1.1 | +0.2 |
| San Diego | 143.5 | 52.7 | 55 | 9 | 18 | -0.1 | +1.5 | +0.2 |
The Method(s) to the Madness
Because I had to pick some cutoff point, I took the top 30 combined statistical areas3 by population in the US and used a radius of 100 miles around each metro area (centered on the City Hall of the principal city). Why 100 miles, rather than 10 or 500? The thought was that it seemed like a reasonable distribution radius for most small breweries. Also, it’s a nice round number that makes me feel all warm and fuzzy inside.
Quantifying quality
The first thing to remind everyone is that this dataset is already of breweries that have a metarating of 3.5 out of 5 or better. That is to say: there isn’t, according to the masses, a bad brewery in the bunch. Thou shalt not find a Coors, or a Schlitz, or PBR. “America’s Oldest Brewery” didn’t make the cut. Sam Adams did (barely, with 0.03 to spare). Places with multiple breweries or pubs4 only counted once (the “main” or first location).
For each metro area, I took the average rating of all breweries. Then, in order to reward truly outstanding beer, I’ve also given a bonus for the percentage of breweries rated at 4/5 or better. 155 out of 2894 (already pretty good) breweries in the dataset make the “superlative” cut, which comes to a shade over 5.3% of the total. So, any bottle in that ultra-top-tier that you can get your hands on should count extra. Says me.
That makes the final calculation for quality come out to: Avg. metarating x (1 + % superlative)
Quantifying quantity
To the utter shock of 0.0% of the population, the quantity of good beer in a given metro area is much easier to put into numbers. That’s why they call it “quant”-ifying, I guess. It was a simple case of looking at the distribution of numbers of breweries within our top 30 metro area sample, and computing a z-score. Easy-peasy. That’s why we have Excel (or Google Sheets, if you’re into that sort of thing).
The Basic Booze Index
Ignoring cost, it’s just quantity plus quality (added so that a city with negative z-scores in both isn’t rewarded because of sneaky math shenanigans). So BBI = (z-score quantity + adj. z-score quality) * 100
Quantifying cost
This was harder than anticipated, since finding reliable measures of the average cost of a pint (or bottle, or six pack, or keg) in each of the thirty cities was way harder than anticipated. So, we used the less-than-perfect Bureau of Labor Statistics’ Consumer Price Index for Food and Beverages. This measure includes alcohol of all kinds and as a gross measure of food and beverage prices, it is way less volatile than the CPI for Alcohol, which is way more subject to many states’ tax on hard liquor or control of sales through state stores, which doesn’t really apply most of the time when we’re discussing “a hypothetical selection of pints out at a bar.” This is imperfect as hell. I know. But it’s also probably the best we can do without sending volunteers out into the wilds of each city to do “research” and then controlling for drunken reporting and boosterism.
In the Adjusted Booze Index, I weighted cost at a 20% factor, with quantity and quality again equally weighted (40% each). This decision was made because anyone who doesn’t at least count quantity of good booze and quality of said booze twice as much as how much it costs isn’t really a beer nerd. After a little bit of flattening of the outliers5 on the cheap end of the scale, the calculation becomes ABI = (z-score quantity * 0.4 + adj. z-score quality * 0.4 - adj. z-score cost * 0.2) * 100
Overlapping metro areas
Another complicating factor of the 100mi radius is that it leads to a fair amount of overlap between certain metro areas (The Eastern Seaboard, LA & San Diego, the SF Bay Area and Sacramento, for example). From a statistical standpoint, this isn’t ideal, though it is relatively reflective of reality. Someone in LA can generally get their hands on microbrews from San Diego without too much trouble. Same goes for Philly beer lovers and brews from New York.
Restricting the radius further has a tendency to punish less densely populated regions (even more), dropping a lot of the suburban and rural breweries out of the dataset. If someone wanted to evaluate the top 10 metro areas in the US, 50 miles would make sense, and cut out almost all the overlap. But comparing Portland, Indianapolis, Chicago, and New York on those terms doesn’t make a whole lot of sense.
Next up
Now that we’ve covered the good, the logical follow-on is to dig into the bad. In a mocking mood? Want to cross certain cities off your travel list?
Head on over to Beer Gazetteer no. 3: The loneliest, least beertastic metro areas in the US!
Notes:
1 ±0.0009573%^
2 To Miami!!!! Who saw that one coming?^
3 I figured that the US Census Bureau was a safe enough source for this.^
4 Some prominent examples that show up in the dataset: McMenamins’ slew of brewpubs around Portland, Oskar Blues’ breweries in Colorado and North Carolina (I counted the one in Longmont, CO), and the spread of Gordon Biersch (San José, CA) and Rock Bottom (Broomfield, CO) to be basically everywhere.^
5 Specifically, z-score cost was basically a normal distribution for 28 out of the 30 metro areas….and Phoenix and DC had scores of -3.96 and -3.43. Every other CSA fell between -1.03 (Tampa-St. Pete) and 0.96 (Twin Cities), and the two outliers so threw the model out of whack that it was giving DC the top spot (in spite of a -1.21 z-quality score) and Phoenix the #6 spot in spite of only 17 qualifying breweries in the 100mi radius (just sliding in behind Chicagoland’s 101). This, suffice to say, did not past the crazy test.
So, I applied a flattening criteria to the crazy outliers, dividing the difference between a metro area’s z-score and the dataset average by a factor corresponding to the integer of Standard Deviations it was from that mean. Thus, the middle of the distribution was unaltered (z-score of -1.99 to 1.99), anything ±2.00-2.99 St.Dev from the mean would have that difference cut in half, ±3.00-3.99 St.Dev divided by 3, and so on. The only two metro areas affected were Washington and Phoenix.^
No Comments on "Beer Gazetteer: Where should the beer nerds move?"