
By: Patrick W. Zimmerman
So just how fat are those Capitalist oppressors, and how much do some of the biggest companies in the US let that sweet, sweet wealth trickle-down? What economic sectors tend to have the most exploitative pay ratios? Which are the most likely to pay a living wage?
Well, we actually have some information on that now. The Dodd-Frank Wall Street Reform and Consumer Protection Act mandates CEO compensation and median employee compensation disclosure filings for the 2018 tax year. For now, at least, as a bunch of rich guys in the Senate try to roll back the Act.
CNBC recently released a quick take on the Tech sector that highlights the role that making physical stuff has on median employee compensation. In tech, at least, if a company just makes software (say, Facebook), its median wage is higher because it doesn’t need to employ lower-paid laborers in distribution or manufacturing like, say, Amazon. We’re going to go a bit broader, looking at 10 companies with already-filed Definitive Proxy Statements (DEF 14A in Edgar / SEC speak) in each of 7 economic sectors (70 companies in total): Tech, retail (including food service), manufacturing (heavy and light combined), finance, transportation, energy, and health.
Does the physical stuff v. virtual / services dichotomy (also understandable as a level of education in the workforce) hold true across our diversified dataset? Sorta. There are some major exceptions (like the energy sector).
Given that we’re using data from the SEC, we’ll go with their definitions of income. This means that the following forms of compensation are counted towards the Dodd-Frank CEO pay ratio:
- Salary
- Stock awarded in 2017
- Bonuses
- “Other income”
Total compensation does not include:
- Value increase of already issued stock
- Proceeds from the sale of stock (by the employee or CEO).
So Dodd-Frank pay ratios are a measure of compensation, not wealth, but the former at least provides a window into the latter. Equity sales and valuation increase are big loopholes that this will not take into account, loopholes that several tech giant CEOs clearly exploit.

The question
Who are the Ebenezer Scrooges of the 21st century, and who follows the Fordist model of maintaining a capitalist income gap (but not one so bad the workers revolt) with a heaping side of consumerism?
In other words, is there a pattern to how companies in certain sectors compensate their execs and their employees?
The short-short version
Yup, there are a couple of patterns. Principally:
- The retail sector is as exploitative as you thought it was.
- The tech sector is….ok. While there are some companies that clearly spread the wealth around to keep their employees happy (and productive), there are some notable shenanigans in the reporting (more on that below).
Pay ratio by sector
Mouseover (or click) to interact with dashboard.
ReTAIL! Woof, you jerks. Yes, the retail sector has a number of part-time and temporary employees, driving down that yearly earnings number. And that’s better, how, exactly? If anything, paying several people a pittance (with no benefits given the part-time nature of the work), is more ethically problematic than paying one person an equivalent number of hours at the same rate.
The energy sector might surprise a few people at first with the highest median compensation and one of the highest CEO compensation packages. Part of it is that the energy sector has a long tradition of extensive bonus and incentive packages for skilled field workers. For example, the oil field services company Schlumberger describes its median employee thusly:
…a full-time, salaried employee located in Colombia and working as a Wireline Field Engineer, who is paid a base salary of $38,893….[and an] annual total compensation to that employee of $88,604. The difference between the median employee’s annual base salary and the employee’s annual total compensation represents the cash incentive compensation earned by the employee in 2017 due to field bonus pay plus payments related to a food stipend and cost of living expenses for his location.
So, apparently, working as an oil engineer on a rig that struck black gold in Colombia > working as a software engineer in Cupertino or Mountain View.
Speaking of the tech sector, on average it pays its employees well (hi, Amazon!). This isn’t too surprising given the high number of engineers, marketers, and data scientists that software development requires. None of those areas are particularly low-paying jobs. Tech CEOs do correspondingly well on average.
The Big Bad Banks were….not as bad as I expected. Honestly, they were basically the targets of Dodd-Frank (it’s called the Wall Street Reform act, after all), and they’re pretty bad. But the financial sector does not represent an outlier in any direction. As you can see from the by-company breakdown below, they kind of all cluster around the middle of the graph.
Dodd-Frank disclosures, company by company
A few notes on shenanigans and other absenes from the list:
- Apple, Microsoft, and Starbucks, because their fiscal years recently ended, have not yet filed DEF 14As that required the Dodd-Frank disclosures. So wait on them.
- According to Twitter, its CEO, Jack Dorsey, “had annual total compensation for 2017, calculated using the requirements of Item 402 for purposes of the Pay Ratio Disclosure, of $0.00 because Mr. Dorsey declined all compensation during 2017.”
- Alphabet (Google)’s filing included the heartwarming story of how “In 2004, Larry [Page] and Sergey [Brin] asked that their salaries be reduced to $1 each per year. Since 2005, the Leadership Development and Compensation Committee has annually assessed peer company practices and offered Larry and Sergey market-competitive salaries. For 2017, Larry and Sergey once again declined our salary offers and therefore received salaries of $1 each.” Isn’t that nice of them?
- Amazon’s filing lists Jeff Bezos’s compensation at $1,681,840.00, yet he also regularly appears on lists of the world’s wealthiest individuals.

All together now: buuulllllllllllll. Shiiiittttttttttt.
The big board
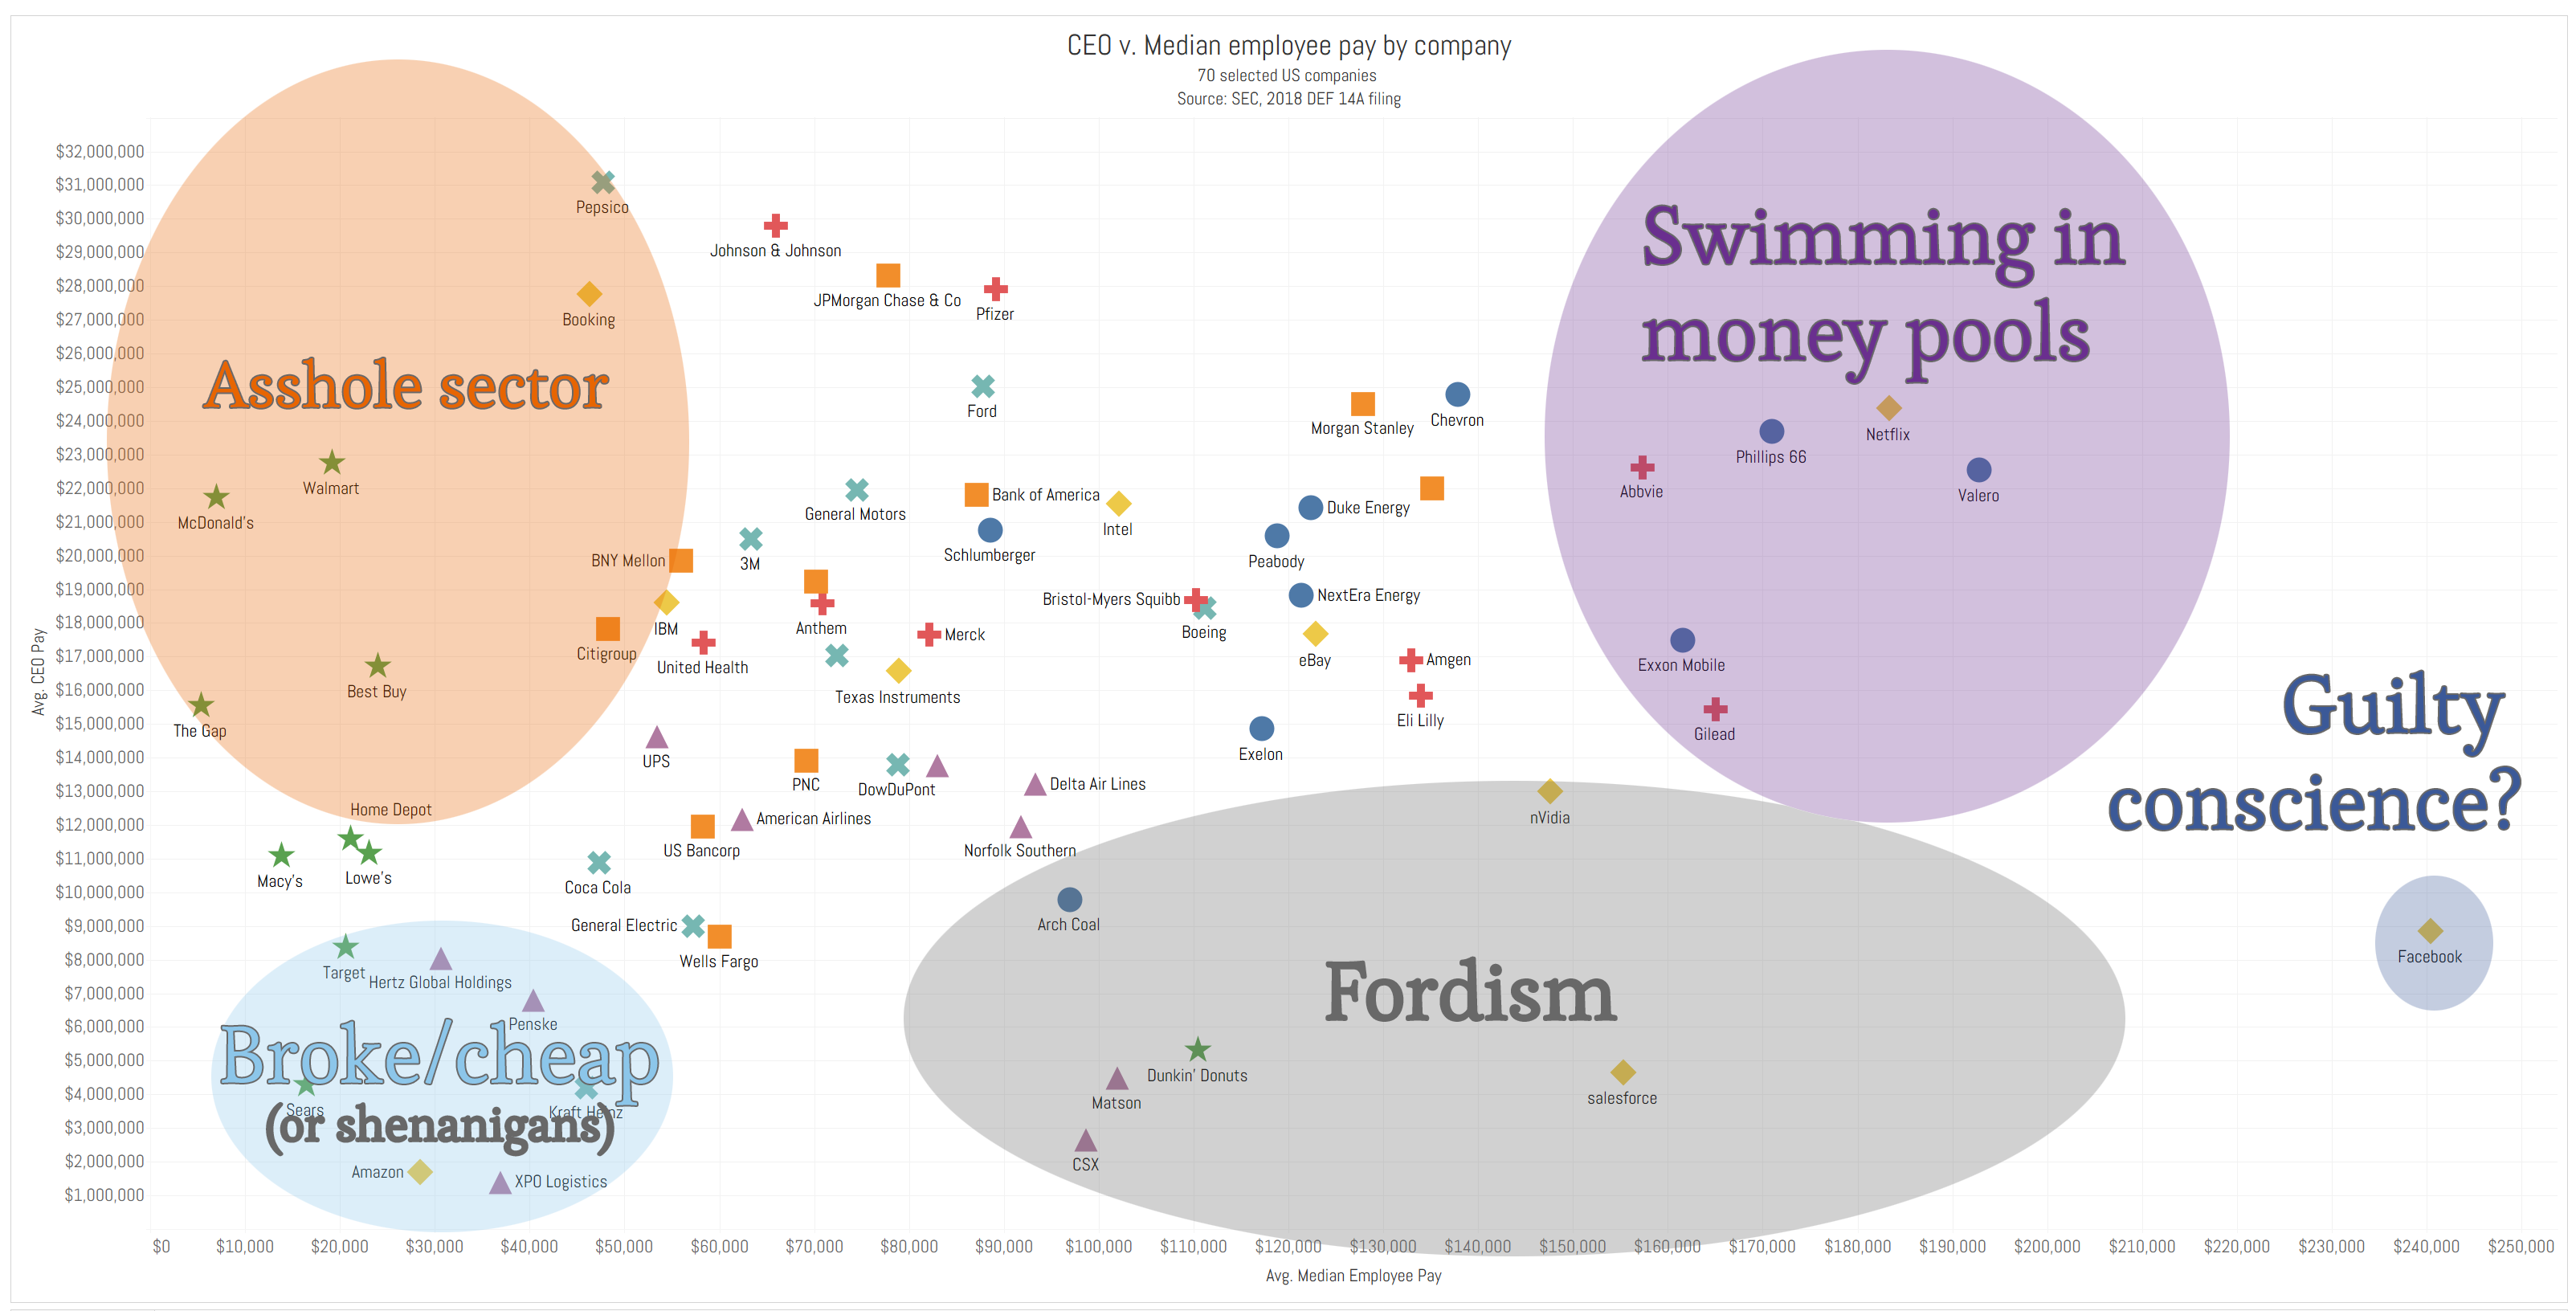
First, a handy legend to help you interpret the dashboard (the labels work out the same both on the aggregate chart above and the company-specific one below).
Mouseover (or click) to interact with dashboard.
Notable highlights from the company dashboard:
- I would not have called that Pepsico had the highest CEO compensation. Followed by Johnson & Johnson, JP Morgan Chase, and Pfizer (ok, those are a lot less surprising). Apparently, they’ve diversified enough that the soft drink ban hasn’t really hurt them.
- McDonald’s and Walmart = assholes. Also surprising no one, but McD’s 3101:1 CEO to employee ratio is particularly galling. Only 2 other companies (the Gap, 2900:1 & Walmart at 1188:1) were even in 4 digits. The Gap isn’t that surprising that it’s in this group once you stop and think about, you know, the garment industry.
- The rolling in giant piles of dough area: 3 oil companies, Netflix, and 2 pharmaceutical companies. Yeah, that smells about right. Gas is getting close to $4/gallon, Netflix just passed 125 million subscribers, and the Centers for Medicaid and Medicare Services forecasts accelerating growth in prescription drug prices.
- I’m not really sure what’s up with Facebook. Guilt? Maybe it wants its employees to think it’s a community, not a company. Or something. Also, Zuckerberg might have pulled in $8.8 million in new compensation in 2017, but that is likely only a fraction of what he earned overall.
- Department stores seem like they’re in desperation territory, which pretty much mirrors what has been a story for several decades, a related phenomenon to why America’s shopping malls are decrepit.
- Dunkin Donuts….pays its employees ok? Even with a mental adjustment for the fact that they took a bunch of part-time employees and annualized their salary to inflate the number by focusing on yearly rate rather than real take-home pay, it’s an interesting outlier in the food service group.
- Ford doesn’t fall into the Fordist category. Which is amusing.
What’s next?
Other than putting pressure on Congress to keep the financial regulation of Dodd-Frank and not do another business-friendly repeal?
Vote with your wallet. If you think CEOs deserve 100s (or 1000s) of times their employees reward for their labor, then keep on keepin’ on. If not, maybe funnel your disposable income towards some of the companies on the lower right of this dashboard, not the upper left.
Also, don’t eat at McDonald’s. For plenty of reasons.
No Comments on "The Montgomery Burns Index – Using Dodd-Frank to see how much more CEOs make than their employees"