By: Patrick W. Zimmerman
Pennsylvania’s congressional districts are making a mockery of democracy (we’re sure we saw that wording in the official court ruling somewhere, right?), unequally drawn constituencies decreed by the Pennsylvania Supreme Court to be violating voters’ rights to “free and equal representation.” SCOTUS agreed.
It was bad. This should make things a little better, depending on the new district boundaries. More evenly-populated districts = more democratic. Got it. That’s not too complicated.
So how does this (deplorable) current situation compare to the history of Pennsylvania? Is there any kind of place where, you know, people keep records about this kind of thing? Like, say, the count of persons and distribution of representatives? Hmmm.
Oh, right, the US Census. Its explicit purpose was to count the number of citizens (and 3/5 of every slave) for the purposes of representation, and write it all down every 10 years. That’s convenient.

The question
How does the current level of population asymmetry in Pennsylvania’s Congressional Districts compare to its level since 1933 (the earliest point at which Congressional Districts are broken out as a separate category, in the Census of 1930)?
More specifically, we’re going to look at how the coefficient of variation changes with each redistricting in Pennsylvania. That is to say, the Standard Deviation in population of the Congressional Districts, taken as a percentage of the average (rather than as a raw number), which corrects for the changing overall population of the state over time. In short, just keep in mind that lower coefficient of variation = more evenly sized districts.
The short-short version
Asymmetrical representation is a bad thing in a system that pretends to be Democratic. It’s easy to measure and related to (but not quite the same thing) as gerrymandering, because the latter is about party/race asymmetry and the former is raw population. Also, gerrymandering requires intentional shenanigans, whereas some changes (such as any change in variation between redistricting due to population movement) are not directly controlled by the state.
The current level that triggered the court decision is not as bad as pre-civil rights norm, but orders of magnitude worse than 1973-1998 (always less than 0.56% and as low as 0.01%).
The Civil Rights Era dropped a really fantastically unequal set of districts (up to 21%!) to almost perfectly symmetrical. Intentionally.
And then, in 1999, those reforms got dialed back in PA, raising the variation by a couple orders of magnitude from 0.01% back to 6%. It’s currently at 2%.
Representative equality in Pennsylvania, 1933-2017
Note, the datapoints in this chart mark the start of each new congress after a redistricting. One assumes some unknown level of fluctuation in between due to population change within those fixed boundaries, but it is difficult to track given the census’ 10-year periodicity.
Holy Civil Rights Era, Batman! For the three decades between the passage of the 1964 Civil Rights Act and the end of the Clinton Administration, Pennsylvania saw an era of equal representation (in terms of raw population) that has no analog at any point in American history. The standard deviation for congressional districts after the 1993 redistricting was 56. People. Out of an average district population of 565,793.
What’s more, the creation of a symmetric system of representation was of explicit interest to the Johnson Administration….and it picked the same metric to focus on that we did: percent of deviation of population in congressional districts (no, we had no idea about that until we started digging back through the old decennial censuses). Unique among administrations, the Great Society project involved the creation of two additional supplementary census reports about the distribution of seats in the House of Representatives, in 1966 and 1968 (usually, these reports are only issued for the first Congress following every census). On page one of each of those reports (PC(SC)-53: 1960 Population of Congressional Districts for the 90th Congress & PC(SC)-56: 1960 Population of Congressional Districts for the 91st Congress. Both are available as part of a single .pdf from the US Census’s Decennial census archive.
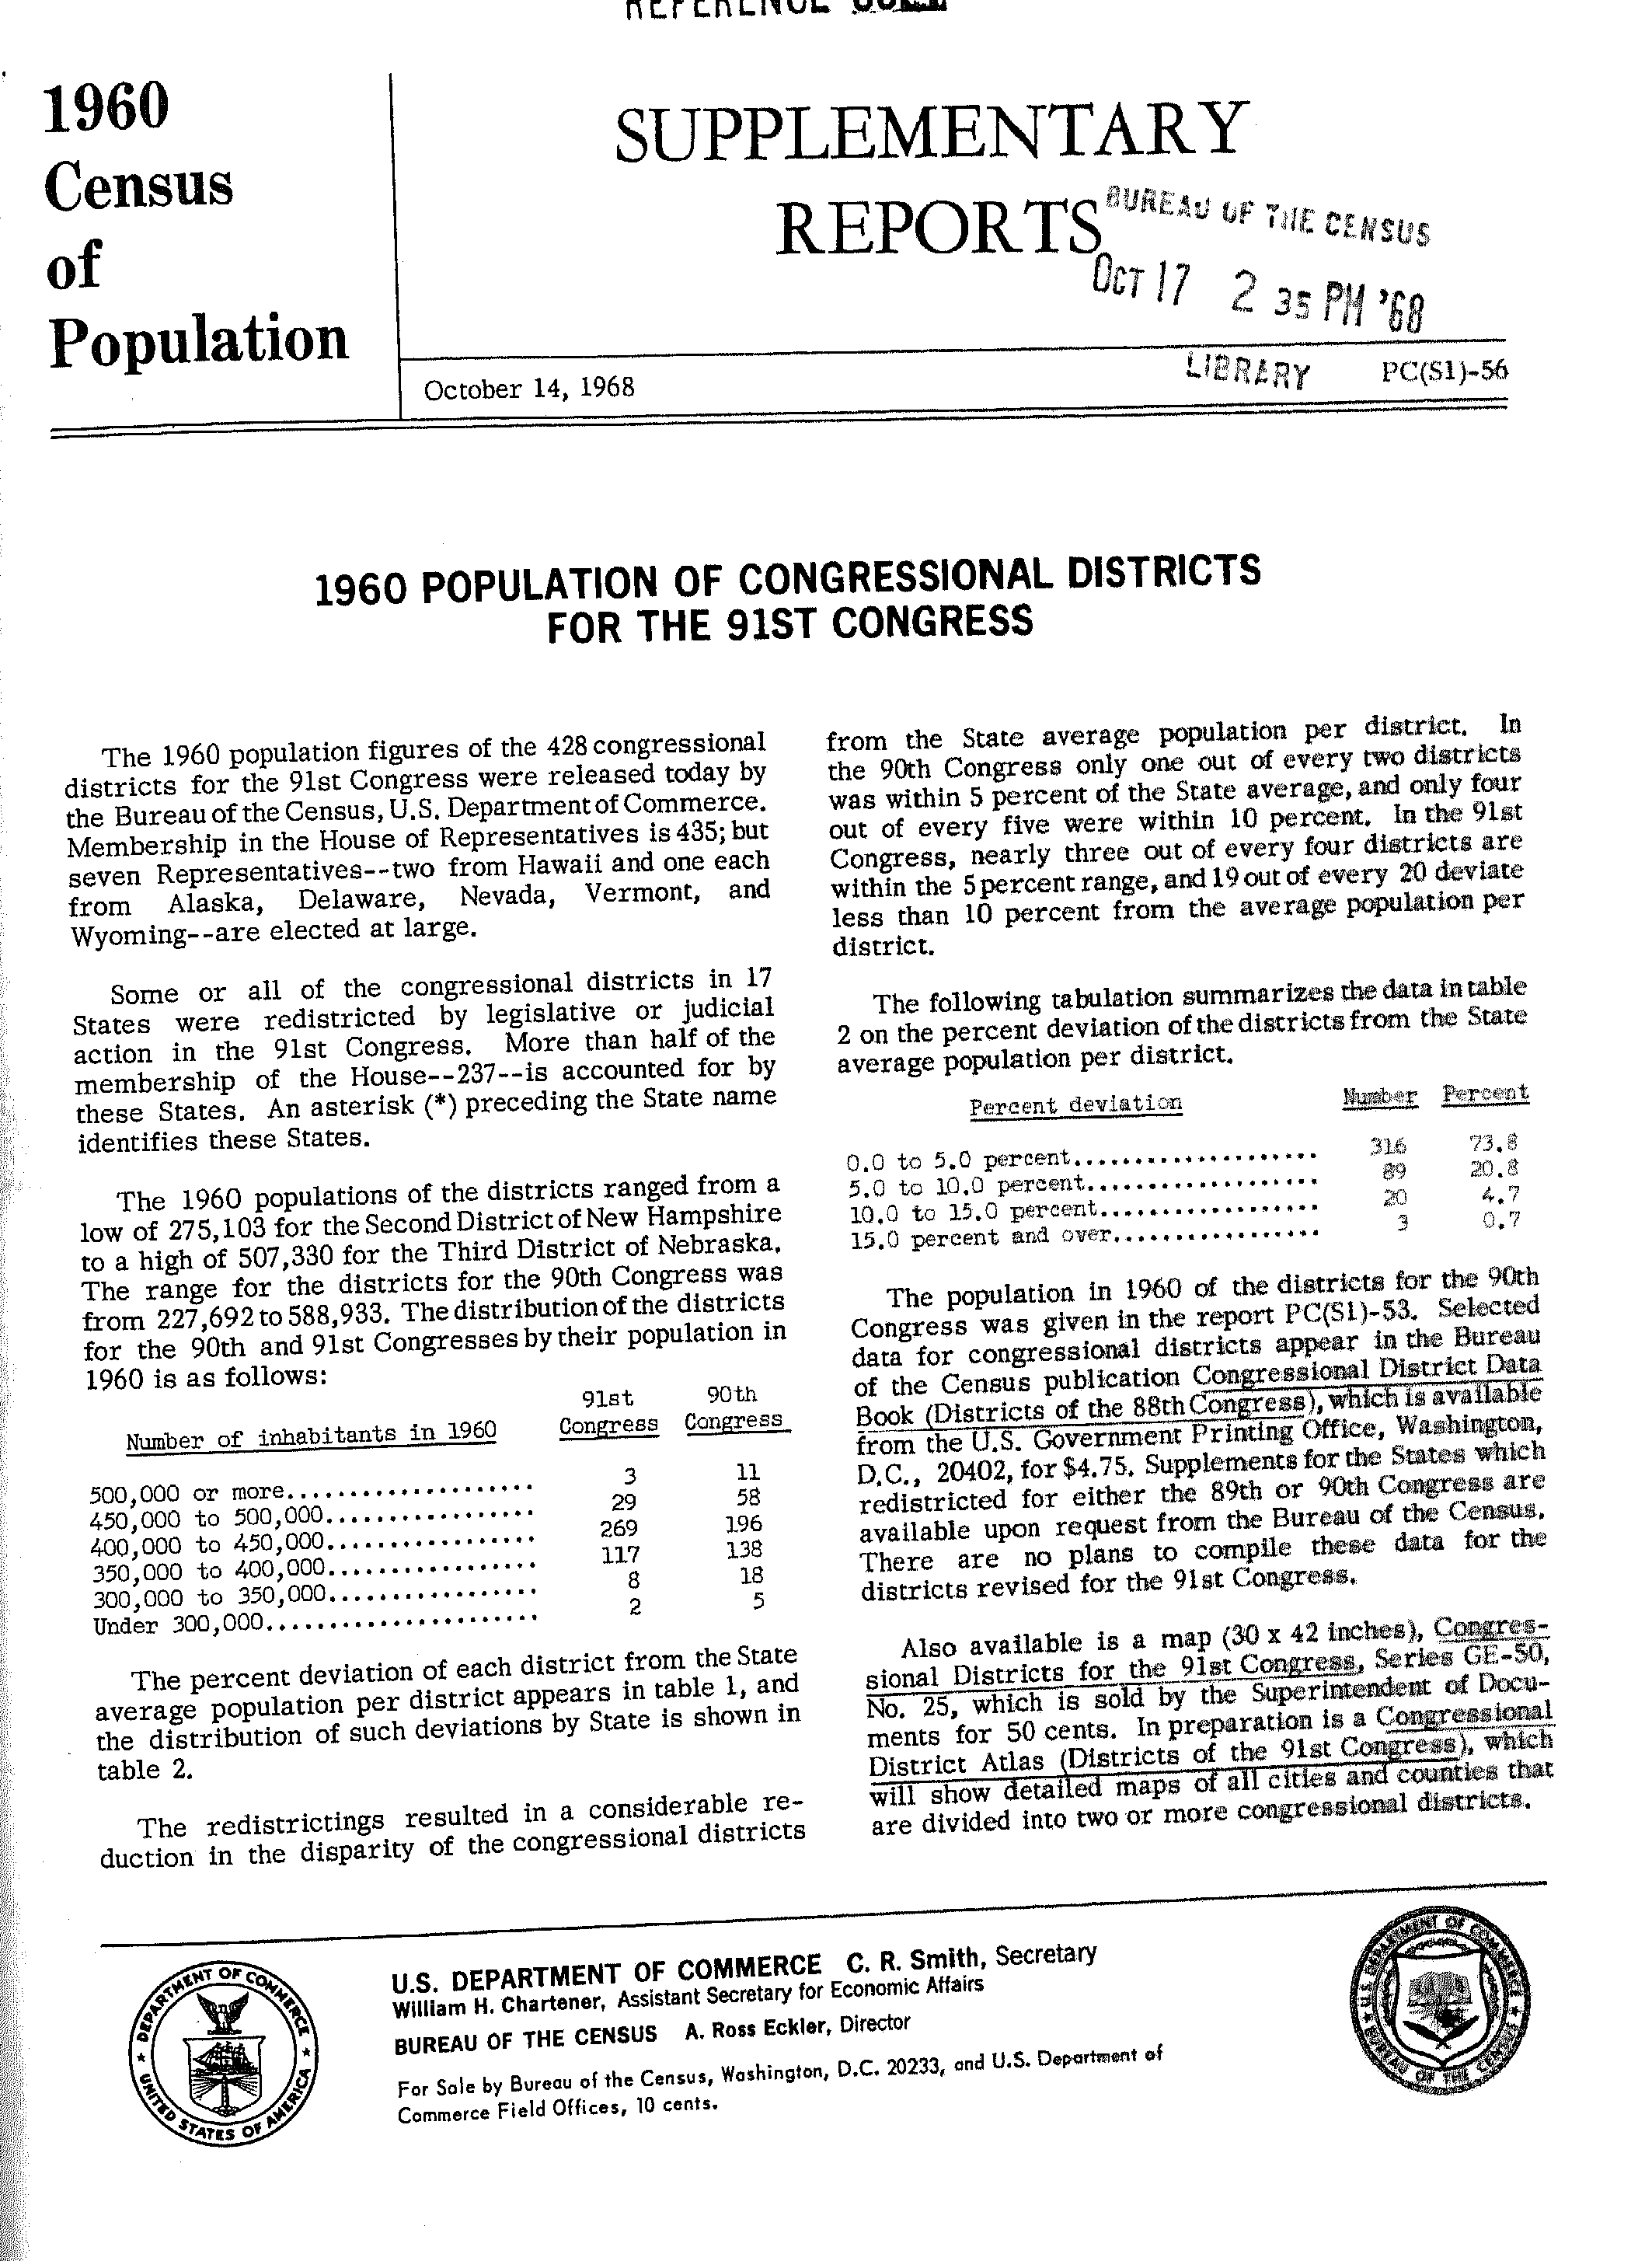
“The redistrictings resulted in a considerable reduction in the disparity of the congresional districts from the State average population per district. In the 90th Congress, only one out of every two distrcits was within 5 percent of the State average, and only four out of every five were within 10 percent. In the 91st Congress, nearly three out of every four districts are within the 5 percent range, and 19 out of every 20 deviate less than 10 percent from the average population per district.”
-1960 Population of Congressional Districts for the 91st Congress, PC(S1)-56, p1.
Then, the 1999 redistricting happened. Asymmetry is a simplification of gerrymandering (because party is not taken into account), but it is an indicator of the hard work of partisan heroes like GOP cartographic consultant Tom Hofeller. In line with Hoefeller’s message, Pennsylvania didn’t revert back to the (insanely obviously) undemocratic districts of the 19th and early 20th centuries….but they did roll back Johnson’s reforms.
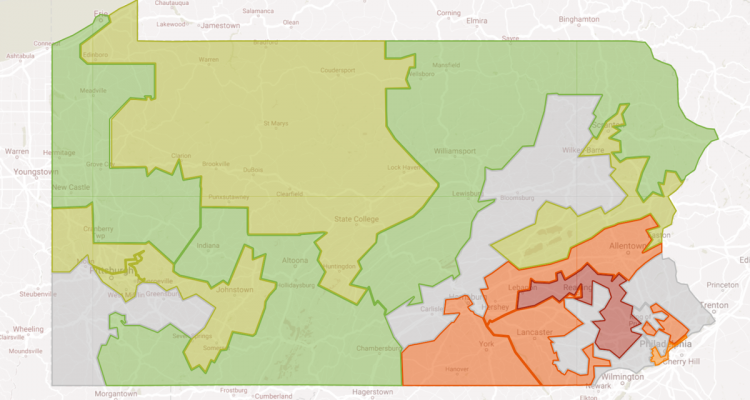
Pennsylvania’s congressional districts for the 115th congress (2016-18)
Green districts are overrepresented (fewer people per representative than average), and red ones are underrepresented (more people per representative than average). Grey districts have a coefficient of variation within 0.5% of the state average. Darker colors signify greater deviation.
The current situation is actually not quite as bad as we’d assumed in terms of pure population variance (in terms of avoiding a Jackson Pollack-style congressional map, it’s real bad). It seems like less of a story that “urban districts are underrepresented and rural ones are overrepresented” than “Southeastern Pennsylvania, specifically the Philly suburbs, gets screwed.” Pittsburgh surprisingly, is a bit below the average population density per representative.
What next?
We’re waiting on the judges, just like everyone else, wanting to see just how much closer to equal representation under the law the next jigsaw puzzle in Pennsylvania actually gets us.
In the meanwhile, it’s time to see if there’s enough racial data in them thar censuses to say anything meaningful.
::digdigdigdigdig::
No Comments on "Pennsylvania’s congressional districts turn back the clock on voting equality"